The conflict between the United States and Venezuela, particularly in 2025 and 2026, has escalated to a point where both military and economic consequences are becoming increasingly significant on the global stage. This escalation began after the US seized a Venezuelan oil tanker, citing violations of sanctions, and deployed significant military assets to the Caribbean. Tensions continue to rise as both nations struggle over control of oil resources and respond to political maneuvering.
The Capture of Venezuelan President Nicolás Maduro: US Military Operation and Political Fallout
Maduro’s capture marked a turning point in the ongoing conflict between the U.S and Venezuela.
The capture not only reshaped Venezuela’s internal power dynamics but also sent shockwaves across the international community. For the rest of the world, such development of Venezuela's President Maduro, raises questions about sovereignty, interventionism, and the precedent it sets for global geopolitics.
Looking ahead into 2026, Venezuela’s political environment is likely to undergo profound shifts. The removal of Maduro creates both opportunities and uncertainties:
Domestic Transition: Competing factions within Venezuela may vie for control, potentially leading to either a fragile interim government or intensified instability.
Regional Impact: Neighboring Latin American states will be forced to recalibrate their diplomatic and economic ties, with some welcoming the change and others condemning the intervention.
Global Consequences: Major powers such as Russia and China are expected to respond strongly in different fronts, framing the capture as a challenge to multipolarity and international law.
Future Outlook: For Venezuela, 2026 could be marked by contested elections, economic restructuring attempts, and heightened social unrest as citizens grapple with uncertainty about the nation’s trajectory.
Understanding the Monroe Doctrine’s Influence on US-Venezuela Relations: A Historical and Geopolitical Perspective
The Monroe Doctrine has played a central role in shaping US foreign policy toward Latin America, including Venezuela. The Monroe Doctrine has been used to justify US interventions, and its relevance in the 2025-2026 US-Venezuela.
What the Monroe Doctrine Is
Origin (1823): Introduced by President James Monroe, the doctrine warned European powers against further colonization or interference in the Americas.
Core Principle: The Western Hemisphere was to remain under US protection, with any external meddling seen as a threat to US security.
Evolution: Initially defensive, it later became a justification for US dominance and intervention across Latin America.
How It Has Been Used to Justify US Interventions
19th–20th Century: Invoked during interventions in Cuba, Panama, and Central America to block European influence and secure US economic interests.
Cold War Era: Used to counter Soviet presence in the region, reinforcing US hegemony.
Modern Examples: Interventions in places such as Grenada (1983) and Panama (1989) were framed under Monroe Doctrine logic.
Relevance in the 2025 - 2026 US - Venezuela Conflict
Revival of the Doctrine: President Donald Trump explicitly cited the Monroe Doctrine to justify the capture of Nicolás Maduro, portraying Venezuela’s ties with foreign adversaries as a violation of hemispheric security.
Strategic Justification: The doctrine was reframed as a “Trump Corollary” or “Donroe Doctrine,” emphasizing unilateral US action to secure its sphere of influence.
This framing transforms the Venezuela crisis 2025 - 2026from a sanctions dispute into a doctrine-driven confrontation.
Global Fallout and Regional Impact:
Latin American states are divided, with some supporting the US stance and others condemning it as neo-imperialism.
International Response: Russia and China criticized the move, arguing it undermines sovereignty and international law.
Future Outlook: Venezuela’s political environment in 2026 is expected to remain volatile, with contested leadership and heightened geopolitical tensions.
US-Venezuela Military Dynamics: An Uneven Power Balance
The US military holds a clear technological and numerical advantage over Venezuela, but Venezuela has developed asymmetric defense strategies to counteract this imbalance.
US vs Venezuela military power comparison Caribbean 2025 chart, troop deployments, naval assets, air power analysis.
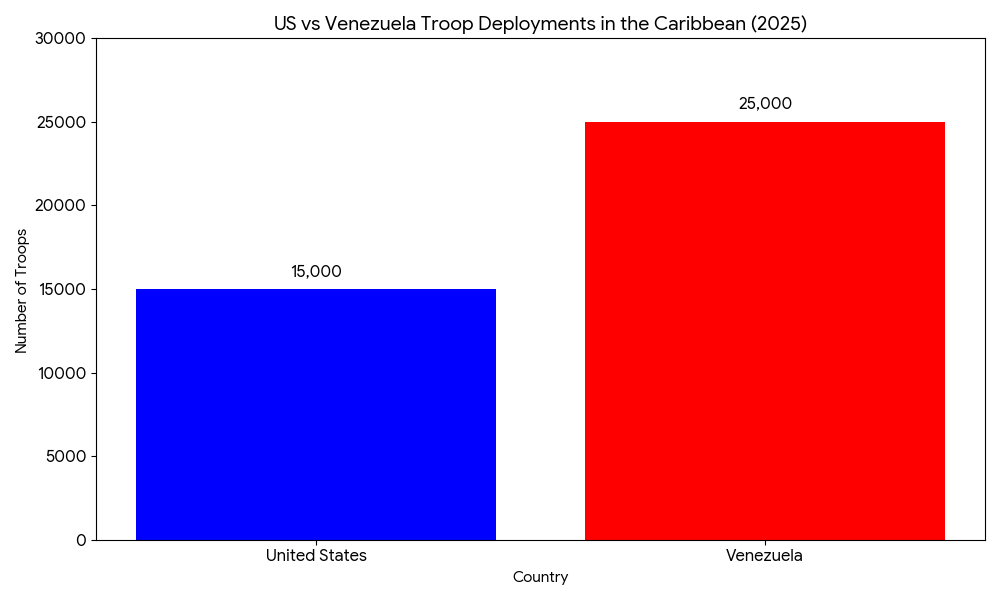
Troop Deployment in the Caribbean
While the US has a significant advantage in troop numbers and military technology, occupying Venezuela would come at a high cost.
US vs Venezuela Caribbean troop deployments 2025 bar chart, military presence comparison, Venezuela 25,000 vs US 15,000 troops.
Internal Political Dynamics: US and Venezuela’s Domestic Constraints
The internal political landscapes in both the US and Venezuela will play a crucial role in the escalation of this conflict. In the US, Congress would likely be a key decision-maker regarding military action. Public opinion, especially in the context of US foreign policy fatigue, could push for a more cautious approach.
In Venezuela, the unification of the military behind Maduro’s regime is a critical factor. While Maduro retains substantial support, particularly among the military, dissent and unrest could undermine his authority, especially in the face of prolonged external pressure.
The Role of Regional Bodies: Implications for Global Governance
Regional organizations like the UN and the Organization of American States (OAS) have the potential to influence the conflict's trajectory. These bodies will likely be involved in diplomatic efforts to mediate and de-escalate the situation, but their ability to enforce peace could be limited.
The involvement of global powers and the lack of consensus on Venezuela within the international community complicate the role of these organizations.
Economic and Geopolitical Impact: The Consequences of Escalation
Oil Market Disruptions and Industry Repercussions
Venezuela’s vast oil reserves make it a key player in global energy markets. The conflict has the potential to disrupt Venezuela’s oil production, which would push global oil prices higher. Given that Venezuela is a major supplier, particularly to countries like China, any disruption would have wide-reaching consequences.
Impact on Major Global Players
China As a major oil importer from Venezuela, China is likely to feel the effects of any disruption in oil supply. This could further strain its energy security efforts, especially given its growing demand for energy and the importance of stable oil imports for its economy.
Iran Iran, which shares some geopolitical interests with Venezuela, could also face significant implications. Any disruption in Venezuela’s oil production could further exacerbate the already strained energy market. As an oil-exporting nation, Iran may see its position in the global market shift, especially if oil prices rise significantly, leading to changes in its own energy exports and relations with other oil-importing nations.
Global Financial Markets As oil prices rise, stock markets in oil-importing nations, particularly in Europe and Asia, would face volatility. Investors would need to brace for oil price spikes and currency fluctuations, especially in emerging markets that rely heavily on oil imports. Increases in oil prices could lead to inflationary pressures, impacting businesses and consumers alike.
Implications for Industries
A disruption in oil exports from Venezuela could severely impact industries dependent on stable energy prices, including manufacturing, transportation, and energy production. Furthermore, insurance premiums for shipping and oil-related businesses could see significant increases due to the heightened risks in the region.
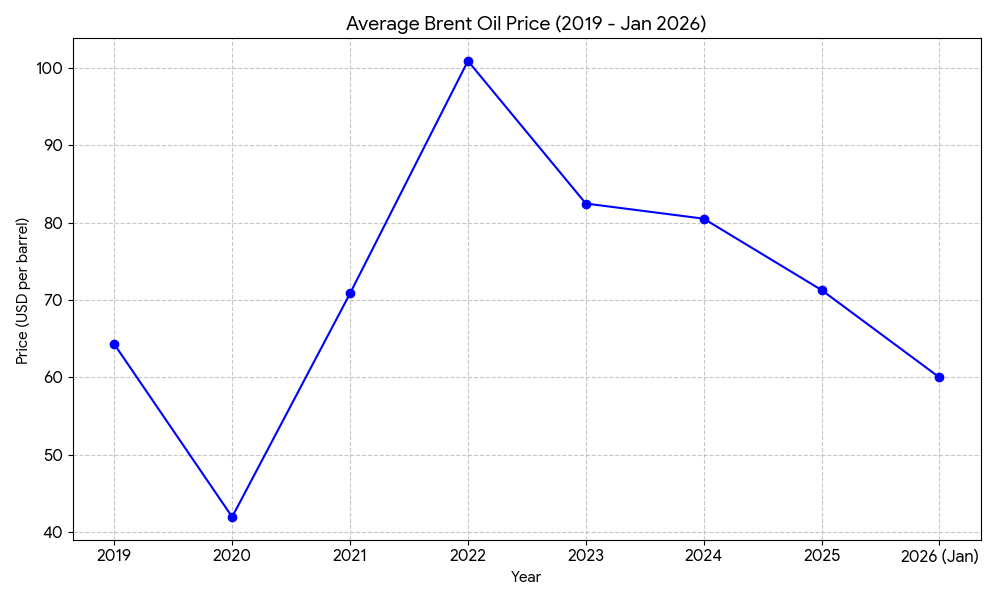
Average Brent oil price 2019–2026 line chart, global crude market trends, pandemic slump, 2022 peak, and 2025 decline. Sources: Statista and US EIA
Key Insights from the Chart
2019–2020: Prices fell from estimate of $64 to $42 due to the COVID‑19 pandemic and global demand collapse.
2021–2022: Strong rebound, peaking at estimated $101 in 2022, driven by supply constraints and geopolitical tensions (including Russia–Ukraine war).
2023–2024: Stabilization around estimated $80–83, reflecting partial recovery and OPEC+ production adjustments.
2025: Decline to estimated $71, showing easing demand and oversupply pressures.
2026 (Jan): Prices trending lower (estimated $60), suggesting weaker global demand and increased production capacity.
Risks
Short-term: Venezuela’s instability could cause sudden price spikes, especially if production halts.
Medium-term: Even with declining Brent averages in 2025–2026, geopolitical shocks from Venezuela could reverse the downward trend.
Long-term: Energy security calculations increasingly factor Venezuela’s reserves, meaning regime stability will remain a critical variable for global oil markets.
Implications to Industries and Sectors
1.Energy-Intensive Industries at Risk: Sectors like aviation, manufacturing, and logistics face rising operational costs and reduced margins.
2.Inflationary Pressures Globally: Higher oil prices contribute to inflation, especially in import-dependent economies across Africa, Asia, and Europe.
3. Geopolitical Leverage for Oil Exporters: Countries like Iran benefit from elevated prices, potentially reshaping global alliances and trade flows.
4.Investor Strategy Shift: Investors may pivot toward energy stocks, commodities, and geopolitical risk hedges, while avoiding vulnerable sectors.
Geopolitical Fallout: Regional and Global Implications
The US-Venezuela conflict would have significant geopolitical repercussions, including:
Migration Pressures: A full-scale war could exacerbate the already severe migration crisis, especially toward neighboring countries like Colombia and Brazil. The millions of Venezuelan refugees would place immense pressure on regional resources and infrastructure.
Geopolitical Realignment: Venezuela’s growing ties with China would likely intensify, complicating US foreign policy. China may increase its support for Venezuela, further challenging US diplomatic and economic strategies.
Energy Security: Europe and Asia could face renewed volatility in oil imports, with Venezuela's role in the global energy market being key. A prolonged conflict could affect energy supply chains and increase energy security risks worldwide.
Caribbean Economies: Countries in the Caribbean heavily reliant on tourism and shipping would face significant economic challenges due to military escalation and the potential for collateral damage in the region.
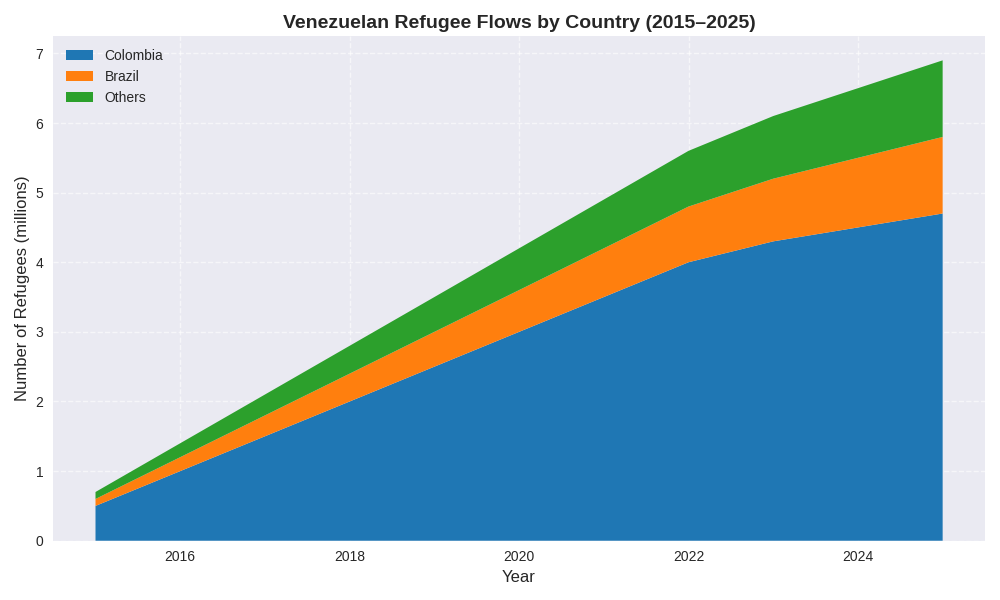
Stacked area chart of Venezuelan refugee flows illustrating migration pressures on Colombia, Brazil, and other countries.
Key Insights from the Chart
Steady Growth in Refugee Numbers: The total number of Venezuelan refugees has consistently increased from 2015 to 2025, reaching nearly 7 million by the end of the period.
Colombia as Primary Destination: Colombia has absorbed the largest share of refugees throughout the decade, indicating its central role in regional humanitarian response.
Brazil’s Rising Burden: Brazil’s intake has grown steadily, especially after 2020, suggesting increased migration pressure and potential strain on public services.
Diversification of Destinations: The “Others” category shows a gradual rise, implying that Venezuelan refugees are increasingly seeking asylum in a broader range of countries beyond immediate neighbors.
Implications
Regional Strain: Colombia and Brazil face mounting challenges in housing, healthcare, and employment for refugees, which may destabilize local economies and politics.
International Humanitarian Demand: The growing refugee numbers call for expanded support from global institutions like UNHCR, IOM, and donor nations.
Migration Policy Pressure: Neighboring countries may tighten border controls or revise asylum policies, potentially leading to humanitarian bottlenecks.
Global Governance Test: The scale and persistence of the crisis underscore the need for coordinated international action and burden-sharing mechanisms.
The Stakes Ahead
The US–Venezuela conflict of 2025-2026 is no longer just a bilateral dispute; it has become a flashpoint with far-reaching economic and geopolitical implications. Businesses, policymakers, and regional governments must prepare for oil market volatility, disrupted trade routes, and increased migration flows. While a negotiated settlement remains possible, the prevailing trend suggests that the conflict will continue to simmer, posing significant risks to global stability.
Key Takeaways from the US-Venezuela Conflict in 2025
1. Military Imbalance: The US has superior military capabilities, but Venezuela’s reliance on asymmetric tactics presents serious challenges to a US occupation.
2.Oil Market Volatility: Disruptions in Venezuela’s oil production could significantly impact global oil prices and affect major players like China.
3. Economic Impact on Regional Economies: Caribbean economies, particularly in tourism and shipping, are vulnerable to the ongoing military buildup and potential conflict.
4. Migration and Humanitarian Crisis: A full-scale conflict could worsen the Venezuelan refugee crisis, with neighboring countries like Colombia and Brazil bearing the brunt.
5.Geopolitical Realignment: Venezuela’s growing ties with China add a layer of complexity to US foreign policy, further influencing the conflict’s dynamics.
1. What are the primary causes of the US-Venezuela conflict in 2025?
The conflict is driven by disputes over oil resources, drug trafficking accusations, sanctions enforcement, and contested elections. Covert US operations have further escalated tensions.
2. How will the US military’s involvement impact Venezuela’s defense?
While the US has superior military technology, Venezuela relies on asymmetric defense strategies, including missile systems and coastal defenses, to counterbalance the US advantages.
3. What effect will the conflict have on global oil prices?
Any disruption to Venezuela’s oil production could significantly raise global oil prices, affecting global markets and industries dependent on stable energy costs.
4.How will the Venezuelan refugee crisis evolve during the conflict?
A full-scale war would likely accelerate migration flows, especially towards neighboring Colombia and Brazil, placing immense pressure on regional economies and humanitarian resources.
5. What role does China play in the US-Venezuela conflict?
China has strong ties with Venezuela and is expected to deepen its support, complicating US foreign policy and adding a layer of global geopolitical tension.
Tensions between Japan, China, and Taiwan have intensified sharply in recent years. Once managed through careful diplomacy and strategic ambiguity, security issues are now expressed through public rhetoric, military signaling, and economic responses. Recent comments by Japanese leaders about a potential Taiwan conflict drew strong reactions from Beijing, highlighting the risks to regional stability and East Asia security.
These developments are part of a larger transformation in East Asia: the decline of post–Cold War restraint, the emergence of hard security blocs, and the use of economic coercion as a gray-zone strategy. Taiwan sits at the center of this evolving strategic landscape, both as a deterrent and a potential vulnerability.
Japan-Taiwan Security Stance: Shifting Rhetoric and Policy
Prime Minister Sanae Takaichi’s statement calling a potential Chinese attack on Taiwan “survival-threatening” for Japan marks a shift from Japan’s historically cautious approach to Taiwan. Under Japan’s 2015 security legislation, Tokyo may act in collective self-defense if a Taiwan contingency threatens its southern islands.
This shift reflects both structural changes and domestic pressures. Political leaders are increasingly willing to challenge postwar taboos due to China’s growing military capabilities and expectations from the United States. Japan’s rhetoric is part of a broader effort to define its strategic identity, moving from strategic ambiguity to strategic clarity, even at the risk of provoking China.
Internal Debates in Japan, China, and Taiwan
The current tensions are not uniform; each country faces internal debate that shapes policy:
Japan: Takaichi represents a hawkish perspective, but parties like Komeito and parts of the bureaucracy worry that strong commitments on Taiwan could draw Japan into conflict or violate postwar principles. Public opinion shows concern about China but reluctance for military engagement.
China: Hardliners push for accelerated action on Taiwan, while economic technocrats warn against escalation that could harm growth or invite sanctions.
Taiwan: The ruling Democratic Progressive Party favors alignment with Japan and the U.S., while opposition parties fear becoming a central target. Public opinion increasingly supports self-defense but prefers avoiding escalation.
These internal differences create opportunities for moderation but also risks of miscalculation. Strategic Theory: Deterrence, Ambiguity, and the Security Dilemma
Japan frames its statements as defensive deterrence, while China interprets them as hostile. This classic security dilemma illustrates how one country’s efforts to increase security can prompt countermeasures by others.
For decades, Taiwan’s stability relied on strategic ambiguity. Japan’s recent language contributes to strategic clarity, strengthening deterrence but narrowing diplomatic space and increasing escalation risks. The challenge is maintaining deterrence without crossing into perceived encirclement.
China Economic Strategy: Response to Japanese Rhetoric
China condemned Japan’s statements, raised the dispute at the United Nations, and warned that any foreign military intervention in Taiwan would be considered aggression against China.
In 2025, Beijing also applied economic coercion measures: suspending Japanese seafood imports and discouraging Chinese tourism to Japan. These actions show China’s preference for gray-zone economic strategies, allowing signaling of resolve without triggering direct conflict.
Military Balance and Regional Vulnerabilities
Beneath diplomatic posturing, military realities are shifting. China continues to expand anti-access and area-denial capabilities, while Japan’s southern islands are within missile range. Taiwan increasingly focuses on asymmetric defense strategies.
Japan has unveiled evacuation plans for over 100,000 residents and tourists from its southern islands in a Taiwan crisis, with drills expected in 2026. These preparations are both practical and symbolic, signaling the real risk to Japan in any Taiwan contingency.
Taiwan’s Strategic Role: Deterrent or Flashpoint?
Taiwan’s growing visibility increases both deterrence and exposure. Explicit alignment with Japan and the U.S. enhances its strategic value, but also makes it more susceptible to surveillance, exercises, and gray-zone pressure. Taiwan is increasingly a focal point for signaling, where even minor incidents could escalate quickly.
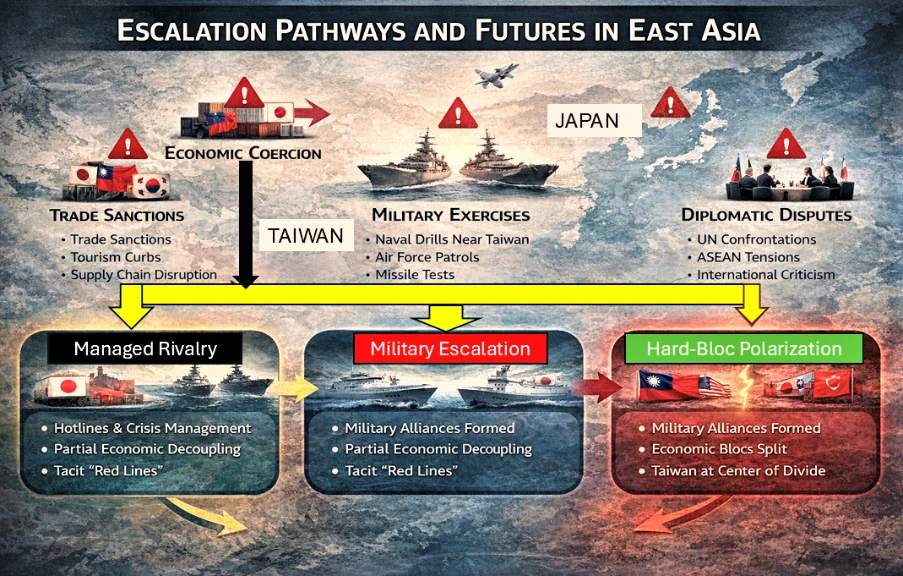
Escalation Pathways and Alternative Futures
Short-term full-scale conflict is unlikely, but incremental escalation is possible where there is:
Expanded Chinese economic strategy against Japan.
Military exercises near Taiwan and the Ryukyu Islands.
Diplomatic confrontations in multilateral forums.
Gray-zone incidents at sea or in airspace.
Potential long-term futures:
Managed Rivalry: Hotlines, forums, and tacit red lines reduce escalation; economic ties remain partially insulated.
Hard-Bloc Polarization: East Asia fractures into opposing security and economic blocs, with Taiwan as the central fault line.
East Asia 2025 escalation pathways showing economic coercion, military exercises, gray-zone incidents, diplomatic disputes, and outcomes: Managed Rivalry vs Hard-Bloc Polarization.
Policy Recommendations for Stability in East Asia
While tensions are rising, conflict is not inevitable. Practical steps to reduce risk include:
Crisis Hotlines: Permanent military-to-military communication channels between Japan and China can prevent misunderstandings near Taiwan and the Ryukyus.
Separate Economics from Security: Agreements via APEC or ASEAN+ to limit economic retaliation during security disputes reduce escalation incentives.
Careful Language: China, Japan and Asia partners while emphasizing maintaining of deterrence should leave space for diplomacy.
Without these measures, Taiwan risks becoming a trigger for broader conflict, and small misperceptions could escalate into crises.
FAQ: Key Questions About East Asia Security Dynamics
1: What is Japan’s current security stance on Taiwan?
Japan’s 2015 legislation allows collective self-defense if Taiwan contingencies threaten Japanese security, especially the southern islands. Recent statements reflect a shift toward clearer deterrence.
2: How has China responded to Japanese remarks on Taiwan?
China condemned Japan at the UN and used economic strategy in 2025, including suspending Japanese seafood imports and discouraging Chinese tourism.
3: Why is Taiwan becoming more exposed?
Closer alignment with Japan and the U.S. increases Taiwan’s deterrent value but also makes it more visible to Chinese surveillance, exercises, and gray-zone pressure.
4: What are the main risks of escalation in East Asia?
Risks include incremental economic coercion, military exercises near Taiwan, diplomatic disputes, gray-zone incidents, and potential blockades or accidental encounters.
5: What steps can reduce the risk of conflict?
Practical measures include crisis hotlines between militaries, insulating economic ties from security disputes, and careful, non-provocative deterrence language.
Australia has been experiencing a housing crisis. The housing crisis didn’t happen overnight. For decades Australia has not built enough homes to match growth in population and households. This persistent shortfall means more buyers and renters are chasing too few properties, pushing prices and rents higher. The crisis can be attributed to soaring demand, constrained supply, high construction costs and slow policy implementation.
The immediate impacts are record-low rental vacancy rates (<1% in many cities), over 30% of low-income households now in rental stress, and homeownership rates for young Australians collapsing. This erosion of secure housing directly undermines the stability that other social policies aim to create.
Australia's Strong Safety Nets vs Housing Market Failures
Australia offers one of the strongest social support systems in the developed world, making its housing crisis unusual.
Income security: Pensions, Jobseeker, Youth Allowance, family payments and income-tested transfers that reduce poverty and smooth income shocks.
Universal healthcare: Medicare and subsidized medicines ensure access to healthcare regardless of income.
Education and skills: Free public schooling, HECS-HELP for university, and subsidized TAFE and vocational training to support upward mobility.
Worker protections.
However, the housing market failure actively undermines these systems. Soaring rents can consume the majority of income support payments, nullifying their purpose of providing security.
Housing stress is a key driver of mental and physical health issues, placing greater strain on Medicare. The dream of upward mobility via education is compromised when graduates cannot afford to live near employment hubs, trapped in long commutes or unaffordable rentals.
The root causes of slow policy implementation are multifaceted, including a tax system favoring investors (negative gearing, CGT discounts), restrictive local zoning, political short-termism, and community resistance to density (NIMBYism), which collectively prevent a supply-side solution.
Australia's Housing Affordability Data: The numbers behind the crisis
A new report indicates that an average of 11.4 years is needed to save for the standard 20% deposit when buying a house in most Australian cities. In early 2002, it took less than seven years to save a 20% deposit.
Line Chart illustrating the rising number of years required to save for a 20% mortgage deposit in Australia, from 6.8 years in 2002 to a projected 11.4 years in 2026.Highlighting the growing challenge of housing affordability.
Key Insights from Line Chart: The rising number of years required to save for a 20% mortgage deposit in Australia
Australians needed less than 7 years of savings to put up 20% of the deposit in 2002.
It rose to 8+ years in 2010, a notable increase, reflecting the rising property prices and later on crossed the 9 year mark in 2015.
In 2020 it entered the double digit further emphasizing the affordability challenges and is projected to be at 11.4 years in 2026.
Data from OECD shows Australia's housing supply in 2022 was 420 per 1,000 people. The number of homes being offered for sale in Australia has fallen since 2015, and the number of homes for rent has been falling since early 2020 (ABC News).
The Cotality Housing Affordability Report (CoreLogic) notes Australian home values have risen by 47.3 per cent (nearly 50%) since the COVID-19 lockdown of 2020.
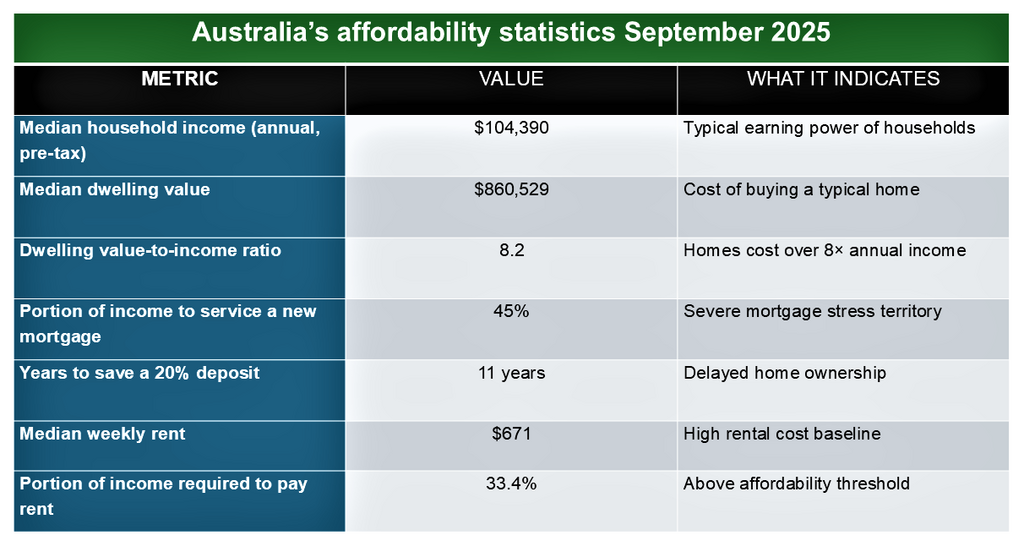
Table showing Australian housing affordability statistics September 2025: 8.2 price-to-income ratio, 45% mortgage burden, 33.4% rent burden, 11-year deposit timeline.
Key Insights from Chart: Australian housing affordability statistics September 2025
Australian housing affordability is under severe pressure.
A median dwelling price of $860,529 which is more than 8 times the median household income. Households now need 11 years to save a 20% deposit.
45% of income is required to service a new mortgage.
Bar chart analysis showing years required to save a standard 20% house deposit across Australia's capital cities in 2025.
Sydney remained Australia's most expensive city, with an average of 16.7 years needed to save for a 20 per cent house deposit.
The most affordable capital cities were Darwin, where only 6.8 years of saving was needed for a 20 per cent house deposit, and Canberra (9.5 years).
$26 Billion Plan vs Reality: Australia's Housing Policy Deliver Gap
The government has made nearly $26 billion in commitments to the housing problem. In the 2024-2025 budgets, it added another $6.2 billion in new commitments to the cause. Those measures will complement the well-publicized "target" to build 1.2 million new, well-located homes over five years, starting from 1 July 2024 to mid-2029.
What's been promised
The measures include:
1. An extra $1 billion to states and territories in support of the Housing Program to help them build infrastructure for new housing (sewage, road, water and power). 500 million had been previously committed.
2. $1.9 billion to increase the maximum rates of Commonwealth Rent Assistance by a further 10 per cent to alleviate rental stress.
3. $88.8 million for 20,000 new fee-free technical and further education (TAFE) in courses relevant to the construction sector.
4. An additional $1.9 billion in concessional loans to community housing providers and other charities to support delivery of new social and affordable homes under the Housing Australia Future Fund and National Housing Accord.
5. Allow foreign investors to purchase established build to rent developments with a lower foreign investment fee.
6. $423m in additional funding to the National Agreement on Social Housing and Homelessness to boost support for social housing and homelessness services (National Housing Homelessness Plan).
Pie chart illustrating government funding allocation: Infrastructure $1.5B, Rent Assistance $1.9B, Social Housing $1.9B, Skills Training $0.09B, and Homelessness $0.42B.Highlights the relative proportions of spending priorities.
Key Insights from Pie Chart: Government funding allocation
Rent Assistance & Social Housing dominate the allocation at $1.9B each, reflecting strong investment in housing affordability.
Infrastructure receives $1.5B, a significant share aimed at long-term development.
Homelessness support is allocated $0.42B, showing targeted but smaller-scale funding.
Skills Training receives the least at $0.09B, suggesting limited emphasis compared to housing and infrastructure.
What has been delivered:
Government Progress to Date:
Supply in Motion: Pipeline data confirms tens of thousands of homes are under construction or completed, though the current pace remains below the 1.2-million-home target.
Immediate Rent Relief: Increased Commonwealth Rent Assistance payments are active, providing direct support to eligible households.
Long-Term Capacity Building: Fee-free TAFE and construction pre-apprenticeships (2024–25) are underway to address chronic skilled labour shortages, a multi-year solution.
Social Housing Pipeline: Contracts for approximately 18,650 new social and affordable homes have been finalized, backed by over $1.2 billion in approved federal loans and grants.
Australia government housing plan 2026 table showing rent assistance, infrastructure funding, social housing projects, construction skills, build‑to‑rent incentives, and 1.2 million homes target with progress updates.
The Australian government needed to facilitate the construction of 60,000 new homes per quarter to meet this target. After a year of underperformance, the target for the remaining four years is now 63,810 new homes per quarter (economic research and forecasting, HIA).
Six Critical Barriers: Why Australia can't build enough homes
1. Build capacity is too low: The 1.2 million target requires an estimated 240,000 homes per year, which is above Australia’s sustained historical construction capacity.
2. Severe labour shortages: A lack of skilled trades (builders, electricians, plumbers) limits how many homes can be built and training new workers takes years.
3. High construction and financing costs: Rising material prices, builder insolvencies, and higher interest rates have made many approved projects financially unviable.
4. Planning and zoning delays: Local planning restrictions and slow rezoning processes continue to block higher-density housing where demand is highest.
5. High interest rates slowed private building: Most homes are built by the private sector, which reduced activity due to higher borrowing costs.
6. The target is non-binding: States face no penalties for missing benchmarks, leading to uneven delivery and weak enforcement.
A chart showing why Australia failed to meet its target of affordable housing.
Key Insights from Bottleneck Analysis: Why targets were missed
The targets were missed because of labour Shortages which contributed to 40% of the cumulative failure highlighting workforce availability issues.
High Costs (35%) represent the second largest challenge, reflecting financial constraints.
Planning delays (25%) contribute a quarter of missed targets, showing the impact of inefficiencies in project management.
Global Comparisons: UK, Canada and the Limits of Policy
United Kingdom (UK)
In the UK, the housing crisis is driven by long-term underbuilding, particularly in London and the South East, combined with restrictive greenbelt policies that limit new development.
High demand from a growing population and international investors has pushed house prices far beyond average incomes, leaving many first-time buyers struggling to enter the market. The UK government has taken initiative by:
Global housing affordability comparison chart showing price-to-income ratios for top 10 unaffordable cities. Hong Kong most unaffordable at 16.7, Australian cities Sydney and Melbourne rank in top 5.
3.0 (Affordable)
5.1 (Severely Unaffordable Threshold
8.3 (Toronto baseline)
Key insights: Global housing affordability comparison
Hong Kong is in a League of Its Own: With a ratio near 17, it is consistently the world's most unaffordable market. Housing costs are attributed to by extreme land scarcity, investment demand, and geographic constraints.
Dominance of "New World" Anglosphere Cities: Australian, Canadian, New Zealand and U.S. cities dominate the list. This reflects a shared set of challenges: restrictive zoning housing as a financialized investment asset, and supply systems that fail to respond elastically to demand.
The Canadian duo,Vancouver (3rd) and Toronto (10th) highlight a parallel crisis to Australia's, driven by high immigration and supply constraints
The U.S. Tech Hub:San Jose (4th), Los Angeles (7th), and San Francisco (8th)represent the high-cost U.S. coastal model, where high wages meet extremely restrictive land-use policies thus crippling supply.
Canada
Meanwhile, Canada faces a similar challenge, especially in urban centers like Toronto and Vancouver, where limited housing supply, restrictive zoning and strong demand from immigration and investors have caused prices and rents to soar. The initiatives are:
National Housing Strategy with federal investment.
Build Canada Homes agency (an estimated $13 billion).
Intergovernmental coordination for approvals & financing.
Policy innovations: public land, GST relief, modern construction technology.
Canada has the largest coordinated federal effort, using a dedicated agency and multi-billion-dollar funding. Australia combines supply targets with social housing and rent assistance, but targets are ambitious and behind schedule. Meanwhile, the UK focuses on tenant protection and targeted subsidies but struggles with supply in high-demand areas. What Australia can learn from Japan's Housing Success
Japan-it has kept housing relatively affordable for decades, even in Tokyo, one of the world’s largest cities and it does this without massive subsidies or rent controls.
What Japan does right
By-right zoning: If land is zoned residential, building approval is fast and predictable.
High-density acceptance: Apartments, mixed-use, and infill housing are normal, not controversial.
Continuous building: Japan builds a lot of homes every year, even as population growth slows.
Housing treated as infrastructure, not an investment vehicle
Global Implications: Housing as Economic Risk in Advanced Economies
1. A warning for other advanced economies. Australia shows that even wealthy, stable countries can reach crisis-level unaffordability if housing supply cannot respond quickly to demand. This is highly relevant for countries like Canada, the UK, Ireland, and parts of the EU facing similar pressures.
2. Housing as a global inflation and inequality driver. When housing absorbs 30–45% of household income, it limits consumer spending elsewhere, worsens wealth inequality between owners and renters and pushes younger generations into long-term precarity
Globally, this reinforces the idea that housing is now a central economic risk, not just a social issue.
3. Constraints on labour mobility. High housing costs reduce workers’ ability to move to where jobs are which lowers productivity, worsens skill shortages and makes cities less competitive.
4. A case study in policy limits. Australia demonstrates that funding alone is insufficient without planning reform and non-binding targets don’t deliver supply. This emphasizes the importance of great policy implementation.
The Way Forward: Policy, Markets, and Citizens
Australia’s housing crisis cannot be solved by funding alone. The path forward requires structural reform, sustained supply, and shared responsibility across government, markets, and society.
Fix supply at scale. Housing targets should be binding, coordinated nationally and backed by infrastructure delivery.
Treat housing as essential infrastructure. Social and affordable housing should be built continuously, at scale, and not for political cycles
Rebuild construction capacity. Skilled migration, apprenticeships and modern building methods must expand the industry’s ability to deliver homes efficiently and at lower cost.
Rebalance housing as a home, not just an asset. Tax, investment, and regulatory settings should prioritize long-term rental stability and livability over speculative price growth.
Align population growth with housing delivery. Migration, labour needs, and urban planning must move together to prevent future shortages.
For Investors Briefing
Short term:
Focus on essential rentals in resilient middle‑ring suburbs near hospitals, schools and transport.
Support build-to-rent models by partnering with government and institutions to increase housing supply.
Medium term:
Invest in construction enablers:prefabrication, materials innovation, and proptech.
Invest outside overheated markets: Look beyond major capitals where affordability and demand fundamentals are more balanced; Perth, Adelaide, Brisbane or key regional hubs.
Long term:
Shift metrics from speculation to stability, efficiency and social impact.
Diversify into alternative real assets (healthcare, logistics) to reduce exposure to housing policy volatility.
Anchor strategy on long-term rental income rather than short-term capital gains.
Key Takeaways: Australia's Housing Crisis
1. Australia’s housing crisis is structural; it is driven by long-term undersupply rather than short-term shocks.
2. Housing costs now consume 30–45% of household income, undermining living standards despite a strong welfare system. Government funding and targets exist, but delivery is constrained by labour shortages, planning delays, and high construction costs.
3. The 1.2 million homes target is ambitious but currently behind pace, highlighting capacity limits.
4. International comparisons show Australia’s challenge is shared globally, but countries that prioritize fast, flexible supply perform better.
5. Lasting affordability will require planning reform, sustained construction capacity, and housing treated as essential infrastructure.
FAQs: Australia's Housing Crisis Analysis
1. What is the main cause of Australia's housing crisis?
The crisis is primarily caused by a structural and decades-long shortfall in housing supply failing to keep pace with population and household growth. This fundamental imbalance is exacerbated by high construction costs, soaring demand, and slow policy implementation.
2. How can Australia have a strong social safety net but a housing crisis?
Australia's robust social supports (like Medicare and income security) exist alongside the housing crisis, which highlights a specific market and policy failure. The crisis actively undermines these other systems, as high housing costs consume welfare payments and negatively impact health and mobility.
3. What are the immediate impacts of the housing crisis in Australia?
The most immediate impacts are severe rental stress (with over 30% of low-income renters affected), record-low vacancy rates, and a collapse in homeownership rates among younger generations, eroding long-term economic security.
4. Why has Australian policy failed to fix the housing crisis?
Policy implementation has been slow due to a combination of factors: tax incentives favoring investors (e.g., negative gearing), restrictive local zoning laws, political short-termism, and community resistance to increased density (NIMBYism).
5. What is the link between housing and social mobility in Australia?
The analysis finds that the housing crisis directly compromises social mobility. Even with strong education supports like HECS-HELP, high housing costs and unaffordable locations near jobs trap individuals, limiting the upward mobility other social policies aim to create.
Foreign Direct Investment (FDI) has long been a cornerstone of Europe’s economic growth, job creation, and technological progress. FDI typically involves long-term strategic commitments, such as acquiring at least 10% of voting shares in a foreign enterprise. It's important to note that the cited EY survey data measures FDI projects, which include new physical operations like manufacturing plants and R&D centers, capturing the broader trend of investment commitments.
Key Takeaway: Europe’s decline in foreign direct investment is not cyclical, it reflects a structural loss of competitiveness driven by geopolitical risk, regulatory complexity, and stronger industrial incentives in rival economies.
Yet Europe’s investment climate has shifted sharply. According to the EY Europe Attractiveness Survey (2025), Europe recorded its lowest number of FDI projects in nine years during the 2024–2025 period. This decline signals a structural change in global investment patterns and raises urgent questions about Europe’s competitiveness.
FDI projects in Europe 2015 to 2025 line graph showing record peak in 2017, post‑pandemic surge, and projected structural decline to 2024 low.
While part of the downturn reflects a broader global slowdown in capital expenditure following the post-pandemic surge, the scale and persistence of Europe’s decline suggest deeper issues tied to geopolitics, regulation, and industrial strategy. This trend is particularly acute for Europe, as investment flows are increasingly re-concentrating in North America and East Asia.
Causes of Europe’s FDI Decline: Geopolitics, Regulation, and Energy Costs
Geopolitical instability has become a major deterrent for foreign investors. The ongoing Russia–Ukraine war has elevated risk perceptions across the continent, particularly in Central and Eastern Europe. Trade uncertainty and political risk have weakened investor confidence throughout the region.
Regulatory complexity has constrained Europe’s appeal. In February 2025, EU officials acknowledged that excessive administrative and sustainability-related requirements were limiting competitiveness, prompting renewed discussions on regulatory reform.
While environmental standards are a core European value, slow permitting processes, fragmented national rules, and overlapping reporting obligations raise project costs and extend timelines, critical factors for multinational investors deciding where to locate new facilities.
High energy prices compound these challenges. Compared to the United States and parts of Asia, European manufacturers face structurally higher electricity and gas costs, reducing margins and long-term predictability. For example, industrial electricity prices in key economies like Germany have remained multiples of those in the U.S., driven by geopolitical supply shifts and network costs.
Structural Competitiveness and Manufacturing Shifts
Europe’s FDI decline reflects deeper structural competitiveness issues. Relative to the United States and China, Europe struggles with:
Slower industrial scaling.
Fragmented industrial policy across member states.
Smaller, less integrated capital markets.
EY reports a sharp fall in manufacturing investment in 2024, as capital increasingly flows toward the U.S. and China. The U.S. Inflation Reduction Act and CHIPS Act provide large, clear fiscal incentives, while China offers scale, speed, and tightly integrated supply chains. These environments reduce uncertainty and accelerate returns as decisive advantages for global firms.
Europe’s policy response, by contrast, remains uneven. National subsidy regimes differ widely, and cross-border projects still face legal and bureaucratic friction within the single market.
FDI inflows comparison chart Europe United States China 2020 to 2025 showing investment trends and projections.
Key Insightsfrom the Actual FDI Inflows: Europe vs. United States vs. China (2020–2025) Europe
Highly volatile flows: from $151B in 2021 to –$106B in 2022 (a net outflow).
Weak recovery: only $16B in 2023, then estimated $182B in 2024 and projected $170B in 2025.
This volatility reflects financial conduit flows (e.g., Luxembourg), making Europe less stable for FDI.
United States
Consistently strong inflows: peaked at $388B in 2021, then stabilized around $285–343B.
Projected to remain the global leader with $330B in 2025, showing resilience and investor confidence.
China
Moderate but steady inflows: $144B in 2020 → $189B in 2022, then declining to $115B (2024 est.) and$108B (2025 proj.).
Reflects reduced green financial FDI and policy-driven shifts, though still significant in scale.
Strategic Implications
Investor Confidence: The U.S. remains the most attractive destination due to policy stability and strong market fundamentals, reinforcing its role as the global FDI hub.
Europe’s Challenge: Persistent volatility undermines investor trust, signaling the need for structural reforms, reduced reliance on financial conduit flows, and stronger strategic autonomy.
China’s Shift: Declining inflows highlight the impact of geopolitical tensions and reduced green finance, pushing China to diversify supply chains and recalibrate its investment model.
Global Capital Reallocation: Investors are increasingly de‑risking by redirecting funds toward stable, policy‑backed markets (U.S.) and emerging hubs in Asia, reshaping the global investment landscape.
Takeaway: FDI flows are realigning toward stability and strategic industries, leaving Europe at risk of marginalization unless it adapts.
Regional Fragmentation of FDI in Europe
The downturn in foreign investment in Europe is not uniform. Central, Eastern, and Southeastern Europe have suffered the steepest declines. According to data cited by EY, total inflows to these regions fell by roughly 25% in 2024. Poland alone experienced a 48% drop.
These disparities reflect:
Higher exposure to geopolitical risk.
Weaker infrastructure in some regions.
Lower fiscal capacity to match U.S.-style incentives.
The result is a widening investment gap between Europe’s core economies and its periphery, threatening long-term convergence within the EU.
Sectoral Shifts and the Decline of U.S. Investment
A notable feature of recent FDI trends in Europe is the contraction of U.S.-sourced investment. EY reports that jobs created through U.S. investment in Europe have almost halved in recent years, indicating a strategic reorientation toward domestic U.S. production.
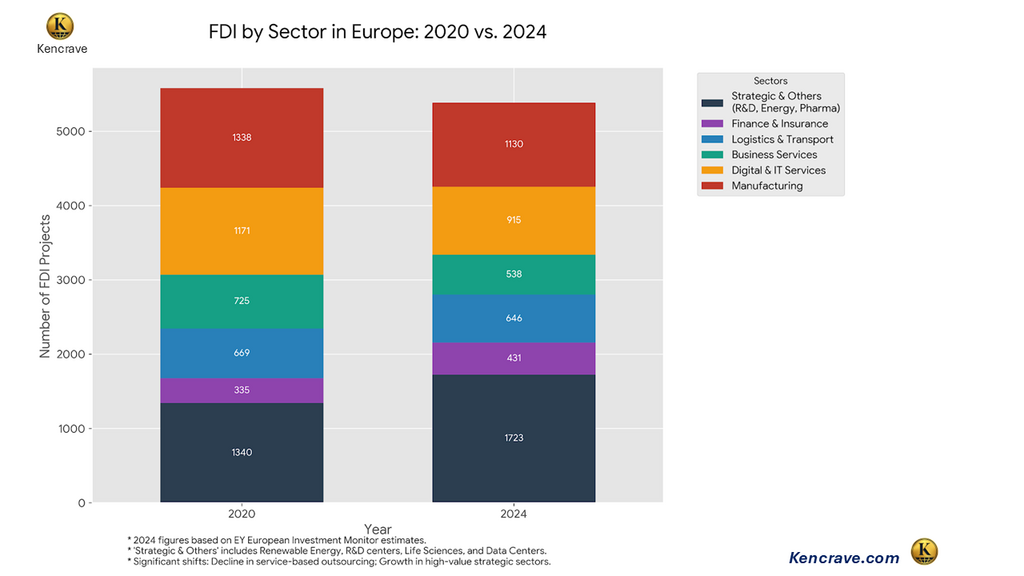
FDI by sector in Europe 2020 vs 2024 bar chart showing investment trends across manufacturing, digital services, finance, logistics, and strategic industries.
Europe remains competitive in logistics and segments of the electric vehicle supply chain. However, high-growth sectors like advanced semiconductors, artificial intelligence, and green energy manufacturing, are increasingly gravitating toward North America and East Asia, where incentives are larger and deployment is faster.
What Europe Can Do: Policy Levers to Restore Investment Appeal
To reverse these trends, Europe must move from diagnosis to action. Key reforms could include:
Regulatory simplification: Streamlining permitting, harmonizing standards across member states, and reducing overlapping reporting requirements.
Targeted fiscal incentives: Coordinated EU-level tax credits and subsidies for strategic sectors such as semiconductors, batteries, AI, and clean energy.
Energy cost stabilization: Long-term power pricing mechanisms for industrial users and accelerated grid investment.
Single-market deepening: Faster cross-border project approvals and unified capital markets to support large-scale investments.
These measures would not replicate U.S. or Chinese models but could restore predictability and scale, two qualities investors value most.
Capital reallocation in strategic assets chart showing Europe’s shift 2020 to 2024 with global investment flows to USA, South East Asia, and China driven by industrial policy and geopolitical realignment.
Long-Term Implications for European Competitiveness
Persistently lower FDI threatens Europe’s position in critical future industries. Reduced investment in AI, renewable energy, and advanced manufacturing may:
Slow productivity growth.
Weaken innovation ecosystems.
Limit high-skilled job creation.
Over time, this could widen the economic gap between Europe, the United States, and Asia.
Bottom Line
Nonetheless, the EY Europe Attractiveness Survey notes cautious optimism. If regulatory reform and industrial coordination materialize, Europe can still leverage its strengths: political stability, skilled labor, and a large consumer market. This optimism is partly underpinned by nascent EU initiatives like the Net-Zero Industry Act and ongoing efforts to advance the Capital Markets Union, which aim to directly address some identified barriers.
Key Takeaways: Foreign Direct Investment in Europe
Europe’s FDI decline reflects structural weaknesses, not just a temporary global slowdown.
Geopolitical risk and regulatory complexity have become decisive deterrents for investors.
The U.S. and China are attracting capital through scale, speed, and aggressive industrial policy.
Central and Eastern Europe are disproportionately affected, widening intra-EU divergence.
Recovery depends on regulatory simplification, energy cost stabilization, and coordinated EU-level industrial strategy.
FAQ: Foreign Direct Investment in Europe
1.Why is FDI falling in Europe in 2025? FDI is declining due to geopolitical risk, regulatory complexity, high energy costs, and stronger incentives in the U.S. and China.
2. Which European countries are most affected? Central and Eastern European states have seen the largest drops, with Poland experiencing nearly a 50% decline in inflows.
3. Is Europe losing competitiveness? Relative to the U.S. and China, Europe is struggling to offer the same scale, speed, and certainty for investors in strategic sectors.
4.Can FDI in Europe recover? Yes, but recovery depends on regulatory simplification, coordinated industrial policy, and energy market reform.
Since its public introduction, artificial intelligence (AI) has evolved from a niche technology into a strategic growth driver for modern businesses. Its ability to analyze vast datasets, automate complex workflows, and generate predictive insights has reshaped how companies compete, innovate, and serve customers in the digital economy. This transformation has sparked intense AI adoption in business strategy, with organizations increasingly viewing AI as foundational to competitive advantage in areas such as innovation, supply chain optimization, and customer experience.
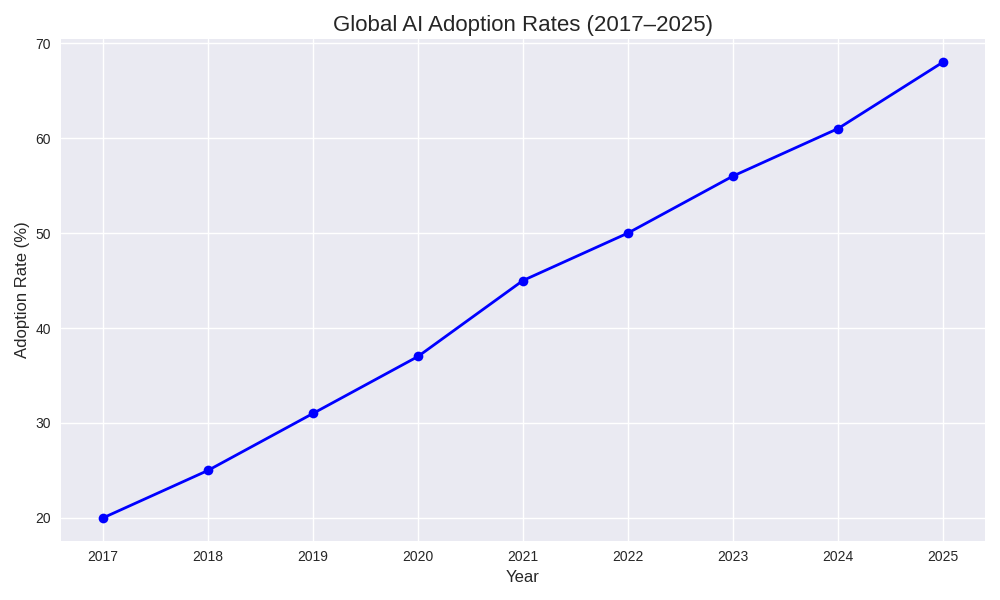
According to the McKinsey 2024 Global AI Survey, AI adoption surged globally to 72% of organizations reporting AI use in at least one business function, reflecting the rapid diffusion of AI across industries and business operations.
Global AI adoption rate 2017- 2025 line chart showing steady growth from 20% to 68% worldwide. Sources: McKinsey State of AI 2024, Statista, and Learn Hub | G2.
Key Insights from the chart
Early adoption (2017–2019): Mostly experimental, with AI used in niche applications.
Generative AI boom (2023–2025): Tools like ChatGPT and DALL·E pushed adoption rates sharply higher, especially in enterprise and consumer sectors.
AI Integration in Modern Business Development
Across sectors, companies are embedding AI‑driven automation, predictive analytics, and business intelligence tools into core processes such as data analytics, cybersecurity, customer service, and market forecasting. By leveraging machine learning models, natural language processing (NLP), and generative AI, firms can identify demand trends, personalize customer experiences, and optimize resource allocation with unprecedented speed and precision.
More than just improving operational efficiency, AI enables innovation pipelines that accelerate product development cycles and support cross‑functional strategic partnerships between tech developers, suppliers, and enterprise customers. As a result, AI is strengthening enterprise value chains and helping businesses unlock new revenue streams and market opportunities.
North American Case Studies of AI Adoption
In North America, AI adoption is particularly advanced and widespread:
Spotify’s AI DJ Feature: Spotify introduced its AI DJ in 2023 to craft personalized music streams based on individual listening behavior, enhancing user engagement and retention.
Figure AI and BMW Manufacturing: In 2024, BMW partnered with Figure AI to deploy AI‑powered humanoid robots in manufacturing lines to reduce worker fatigue and increase productivity, demonstrating practical applications of AI in industrial automation.
These cases illustrate how AI enhances both consumer‑facing services and industrial operational systems, showcasing the technology’s versatility in business transformation.
Why North America Has an Edge in AI Adoption
North America’s leadership in AI adoption stems from several distinct factors:
1. Strong Venture Capital Culture
The region benefits from robust venture capital (VC) ecosystems that fuel early‑stage funding for AI startups. Major investors are backing companies focused on enterprise AI tools, autonomous systems, and predictive analytics, which accelerates technology scaling and market penetration.
2. Top‑Tier Research Universities
Institutions like MIT, Stanford, and the University of Toronto produce cutting‑edge AI research, highly skilled graduates, and industry partnerships that feed into innovation pipelines across sectors.
3. Dense Tech Clusters
Tech hubs such as Silicon Valley, Boston–Cambridge, and Toronto‑Waterloo facilitate collaboration between startups, established enterprises, and research labs, accelerating AI commercialization and workforce development.
4. Regulatory Environment
While regulatory frameworks around data privacy and AI ethics continue to evolve, the relative flexibility of North American policy environments has enabled faster experimentation and adoption of emerging AI capabilities compared with more rigid regulatory regimes.
North America vs China AI adoption metrics: innovation drivers, funding, regulation, and commercialization speed
North America’s private‑sector‑driven model contrasts with China’s state‑led AI strategy, shaping different patterns of investment, deployment, and innovation across global markets.
AI Investment: North America vs Global Trends
Recent data from Statista indicate that North America maintained the highest regional AI adoption rate in 2023, reflecting strong enterprise investment and the integration of AI tools into business workflows. Additionally, regional AI investment analyses highlight that North America commanded a significant share of global AI funding in recent years, signaling sustained investor confidence in AI innovation and commercialization.
This concentration of AI investment reinforces the region’s role as a global AI hub, attracting talent, capital, and strategic partnerships that drive enterprise growth.
Risks, Regulation, and Ethical Considerations
Despite its strategic advantages, AI adoption introduces significant challenges, including data privacy concerns, model bias, workforce displacement, and ethical decision‑making frameworks. Organizations must navigate these risks while ensuring responsible AI governance, transparent data practices, and compliance with emerging regulatory frameworks like Canada’s Artificial Intelligence and Data Act.
Extended Implications for North American Businesses
AI’s influence goes beyond productivity and customer engagement to reshape core business dynamics:
1. Innovation Pipelines
AI accelerates R&D cycles and new product development by enabling faster hypothesis testing, automated prototyping, and data‑driven experimentation.
2. Supply Chain Optimization
AI‑driven predictive modeling enhances logistics planning, demand forecasting, and inventory management, reducing overhead and improving resilience in complex supply networks.
3. Strategic Partnerships
AI insights empower organizations to form data‑centric alliances with suppliers, technology partners, and channel distributors, strengthening ecosystem integration.
Key Takeaways: AI Adoption by Modern Businesses
AI is increasingly becoming a core foundation of business development across sectors.
North America leads in AI adoption due to strong venture capital ecosystems, talent pipelines, and tech clusters.
AI integration supports not just efficiency, but innovation, supply chain optimization, and strategic ecosystem partnerships.
Global comparisons show North America’s private‑sector‑led AI strategy contrasts with China’s state‑directed approach.
To maximize value, businesses must balance AI investment with ethical, regulatory, and risk management strategies.
Bottom Line
AI is no longer optional for modern enterprises; it is central to long‑term competitiveness, strategic innovation, and sustainable growth.
FAQs
1. Why is AI adoption critical for modern business development? AI enables data-driven decision-making, automation, innovation acceleration, and competitive advantage across operations, products, and customer experience.
2. How is artificial intelligence used in business today? Businesses use AI for predictive analytics, customer personalization, supply chain optimization, cybersecurity, automation, and generative AI applications.
3. Why does North America lead in AI adoption? North America benefits from strong venture capital ecosystems, top AI research universities, dense tech clusters, and faster commercialization of AI technologies.
4. How does AI improve supply chain and operational efficiency? AI enhances demand forecasting, inventory management, logistics optimization, and risk detection through real-time data analysis and predictive modeling.
5. How does North America’s AI strategy differ from China’s? North America relies on private-sector innovation and startups, while China emphasizes state-led AI initiatives and large-scale industrial deployment.
UnitedHealth Group’s (UHG) costly exit from South America marks a decisive strategic pivot from global ambition to domestic fortification. Triggered by over $8 billion in cumulative losses, relentless regulatory scandals in Brazil, and mounting pressures on its core U.S. business, the retreat underscores the fatal mismatch between a capital-intensive, vertically integrated U.S. model and the volatile realities of emerging markets. This analysis details the exit’s drivers, contrasts UHG’s failed approach with the adaptive strategies of peers, and outlines the resulting shift toward asset-light, partnership-driven investment in global healthcare.
THE FINANCIAL CATASTROPHE: $8 BILLION IN LOSSES EXPLAINED
UnitedHealth Group (UHG) announced its intention to exit South America in phases beginning late 2022 following a strategic review of its international operations. The withdrawal was not abrupt; it unfolded over several years through asset sales and restructuring. As of November 30, 2025, UnitedHealth Group agreed to sell its last South American business, Banmedica, which operated primarily in Chile and Colombia, to Brazilian private equity group Patria Investments for $1 billion. Reuters
Banmedica is a major health insurer that also runs hospitals and medical centers, with around 1.7 million health insurance members, 7 hospitals and 47 medical centers acrossChile and Colombia.
REASONS FOR LEAVING SOUTH AMERICA AND WHY THE EXIT TOOK SO LONG
UHG sought to refocus on its core U.S. Business strategically.
The non-core markets provide constant operational barriers due to complex local regulations, political and economic volatility (especially in Brazil), currency exchange risks, and fierce competition from well-established local players.
Rising medical cost trends and operational pressures at Optum and other units in the U.S. Due to margin pressure from inflation, labor shortages and elevated medical utilization post-pandemic.
Leadership turnover, including a CEO change that looks to streamline operations, simplify the corporate structure and focus on the most critical growth and stability levers.
In February 2024, UnitedHealth Group suffered a major cyberattack on its Change Healthcare unit after attackers exploited compromised login credentials on a remote access portal that lacked multi-factor authentication. The breach led to widespread system shutdowns, disrupting the largest medical billing and claims processor in the U.S. healthcare system. This accelerated the strategic imperative to simplify operations, reduce peripheral risk exposure, and concentrate capital and leadership attention on the core U.S. market (Change Healthcare).
Why the Exit Took So Long: The Problem with "Hard" Assets
UHG couldn't leave South America quickly because of the very strategy that failed: investing in "hard" assets like hospitals and insurance companies.
Hard to Sell: You can't sell a network of hospitals and clinics as easily as you can sell an app or a service. Finding a buyer with enough money and the right government approvals takes a long time.
Governments Were Watching: Healthcare is a sensitive public service. Governments in Chile, Colombia, and Brazil closely watched the sale to make sure patient care wouldn't be disrupted, which slowed everything down.
They Needed a Responsible Buyer: UHG wanted to sell to a company that could keep the hospitals and clinics running well. This limited their options and made negotiations longer.
A Quick Sale Would Have Cost More: If UHG had rushed to sell, they would have had to accept much lower prices, losing even more money.
Bottom Line:UHG's big investments in physical assets locked them in. When they decided to leave, they were stuck in a slow, expensive, and very public exit process. This is a major risk of the "hard capital" model.
How the Cyberattack Sped Up the Exit
The massive cyberattack on UHG's U.S. business in 2024, targeting its subsidiary, Change Healthcare, becameone of the largest healthcare data breaches in U.S. history. It didn't just cause a mess; it forced the company to make a fast, hard choice about its priorities.
It showed UHG was Vulnerable at home: The attack proved that UHG's core U.S. business was not as secure as they thought. Fixing this huge problem required the attention and resources of the entire management team.
"Protect America First" Became the Rule: After the attack, the only mission was to protect and strengthen the main U.S. business. Struggling operations in South America suddenly looked like a dangerous distraction.
Money Had to Move Fast: The attack cost billions to fix. UHG could no longer afford to spend money propping up its South American losses. That cash was now needed at home.
A Decision Became an Emergency: Leaving South America went from being a "smart strategic move" to an "urgent necessity." The cyberattack made the company's leadership act faster to get out.
Bottom Line:The cyberattack was a wake-up call. It made UHG realize it was spread too thin. Protecting its home base became the only thing that mattered, which meant getting out of South America as soon as possible.
Why the exit is notable
UnitedHealth Group is the largest health insurer in the world, and its withdrawal represents a rare retreat by a global healthcare giant.
The company exited at a substantial financial loss, estimated at over $8 billion in cumulative write-downs.
The exit highlights the difficulty of exporting a U.S.-style, vertically integrated healthcare model into politically sensitive and highly regulated emerging markets.
UNITEDHEALTH GROUP’S HISTORY IN SOUTH AMERICA: ENTRY AND EXPANSION
United Healthcare South America timeline: Brazil entry (2012), Banmédica acquisition (2018), regulatory challenges, strategic retreat, final exit (2025). Source: IPMI Global
UnitedHealth Group’s expansion coincided with a window of regulatory permissiveness that closed permanently after governance failures.
DECODING SUCCESS: THE ADAPTIVE PLAYBOOKS OF BUPA, AETNA, AXA, AND ALLIANZ.
UnitedHealth Group’s exit prompted a cautious reassessment among global healthcare firms. Most did not exit South America, but adjusted their strategies. Global insurers increasingly favor partnerships, joint ventures or insurance-only models.
1. Aetna / CVS Health(U.S)
It is U.S.-centric but has selective international exposure via services, but not ownership.
Contrast: avoids the regulatory and political risk UHG struggled with.
2. Bupa (UK).
Operates under a long-term, slow-growth model and accepts thinner margins in exchange for regional stability.
Contrast: Bupa is patient; UHG wanted scale and faster returns.
3. Axa (France)
Reduced exposure but did not fully exit. Pivoted to partnerships and reinsurance rather than retail health insurance.
Contrast: risk-sharing instead of full ownership.
4. Allianz (Germany)
Focuses on corporate health and specialty insurance.
Contrast: avoids mass market retail and is less exposed to political backlash over pricing and coverage.
Comparative chart of UnitedHealth Group model assumptions versus emerging market realities, highlighting scale, vertical integration, capital strength, and growth challenges.
COMPETITIVE VIEW: THE LOCAL CHAMPIONS THAT UNITED HEALTH GROUP COULD NOT DISPLACE
While UHG struggled, several well-entrenched local and regional players demonstrated how to succeed in South America's complex healthcare markets. Their success underscores the critical strategic missteps of the UHG approach.
1. Hapvida NotreDame Intermédica (HNDI)
Model: Hyper-localized vertical integration Why They Succeeded
Geographic Concentration: HNDI built dense, regional networks
Cost Control through Ownership: By owning hospitals, clinics, and labs, they control the entire care chain, reducing leakage and managing medical costs more effectively
2. Bradesco Saúde /OdontoPrev
Model: Financial-Health Conglomerate Synergy leveraging Brazil's largest private banking network. Why They Succeeded:
Cross-selling Ecosystem: Integrates health insurance with banking products, payroll services, and corporate benefits creating high customer stickiness
Local Regulatory Mastery: Deep, long-standing relationships with Brazilian regulators allow for more predictable navigation of policy changes.
3. Grupo de Empresas (Chile) / Keralty (Colombia)
Model: Cooperative & Social Enterprise with strong community embeddedness. Why They Succeeded:
Mission Alignment over Pure Profit. It was structured as non-profits/ cooperative.
Lower Capital Costs: As member-owned or socially-focused entities, they can operate with thinner margins and reinvest surpluses
Community-Based Care Networks: They built grassroots provider networks aligned with local practice patterns
4. Fresenius Medical Care
Model: Specialized, Niche Dominance in renal care and dialysis services. Why They Succeeded (as a multinational contrast to UHG):
Focused Expertise. Instead of tackling the entire healthcare system, they dominate a single, high-need clinical segment where they can be the undisputed quality and cost leader.
Government Partnership Focus: Much of their business comes from public sector
Comparative table of UnitedHealth Group vs South America local champions showing ownership, regulatory ties, cost structure, and time horizon.
EXPECTED CHANGES FROM THE SALE AND MARKET IMPACT
Short-term effects
Minimal disruption for patients.
Continuity of services under new ownership.
Existing insurance contracts remain valid.
Medium- to long-term effects
Increased cost discipline under private equity ownership.
Possible restructuring of hospital networks.
Gradual pricing adjustments and tighter claims management.
Greater emphasis on efficiency and profitability.
WHY UNITEDHEALTH GROUP FAILED IN SOUTH AMERICA
UHG’s failure was not operational incompetence, but strategic overconfidence, assuming that scale, capital strength and vertical integration would translate seamlessly across borders. In South America, success favored local legitimacy, regulatory intimacy, cost discipline and long-term patience, areas where domestic competitors held decisive advantages.
1. Capital-Heavy, Highly Visible Model
UHG invested heavily in owned hospitals, clinics, and insurance balance sheets, most notably through Amil (Brazil) and Banmédica (Chile/Colombia). These assets required large upfront capital, long payback periods, and continuous reinvestment. Owning hospitals made UHG politically and regulatorily exposed, especially during pricing disputes or capacity shortages.
2. Healthcare Is Deeply Political in South America
Healthcare pricing, coverage, and service quality are treated as social and political issues, not purely commercial ones. Governments intervene aggressively when public dissatisfaction rises. Following the 2016 Amil corruption scandal in Brazil, regulators intensified scrutiny of private insurers. UHG, as a foreign multinational, became an easy political target.
3. Underestimated Currency and Macroeconomic Risk
UHG generated revenues in volatile local currencies while reporting earnings in U.S. dollars, exposing returns to persistent depreciation and inflation shocks.
4. Lack of Patience for Slower, Lower-Margin Growth
Emerging market healthcare rewards long-term presence, incremental expansion, and operational discipline, not rapid scaling or short-cycle returns. UHG sought scale efficiencies similar to its U.S. operations, expecting margins that were unrealistic in price-sensitive markets.
5. Fragmented and Unpredictable Regulatory Environments
South America is not a single regulatory market. Each country and region has distinct rules on pricing, coverage, ownership and capital requirements.UHG faced different regulatory regimes in Brazil, Chile, and Colombia, complicating compliance, governance, and strategic coordination.
Bar chart of UHG regulatory intensity in Brazil from 2012 to 2022, showing spikes in 2016 and 2021.
Key Insights:
Before 2016, there weremanageable regulations, thus business can operate effectively. After the 2016 scandal, the police raided Amil's offices, and executives were arrested for corruption, resulting in massive reputation damage and legal costs. The regulatory pressure did not fully recover, and in 2021 during COVID, the government increased intensity when cracking down on all health insurers.
Map of South America showing regulatory challenges in Brazil, Chile, and Colombia with flags and risk levels.
IMPLICATIONS FOR INVESTMENT IN EMERGING MARKETS
Global capital is becoming more selective due to:
Higher global interest rates.
Reduced tolerance for political and regulatory risk.
Increased focus on liquidity and exit flexibility.
This has resulted in investors prioritizing:
Asset-light models.
Clear exit paths.
Local partnerships.
Revenue diversification across markets.
Lower exposure to political decision-making.
Why local investment is increasing for Local and regional investors:
Better understand regulatory environments.
Face lower currency mismatch.
Have stronger political and institutional relationships.
Are more willing to accept long-term, moderate returns
HARD VS SOFT CAPITAL: THE NEW HEALTHCARE INVESTMENT PARADIGM
UnitedHealth Group’s model
UnitedHealth Group bet on physical hospitals, insurance balance sheets, and local currency. This is hard capitalwhich is illiquid, politically visible, slow to exit and margin-sensitive.
A chart showing UHG $8B capital loss with investment, asset sales, net destruction, and write-downs
Based on UnitedHealth Group's disclosed $7.7B in total South American investments(cumulative investment in Amil (Brazil, 2012) and Banmédica (Chile, 2018)) and estimated total sale proceeds of approximately $2.8B, the company recovered only about 36% of its initial capital. This calculation aligns with the estimated 8 billion in cumulative write-downs UHG reported on these assets in its SEC filings( UHG NEWSROOM(AMIL), UHG bancmedica).
By contrast, telemedicine and AI startups operate on asset-light platforms, software & data, making regional scalability and exits through acquisitions, shutdowns, and pivots easier.
This is soft capital. It is mobile, modular, easier to scale down or up, and less exposed to regulators initially.
STRATEGIC GUIDE: HOW TO INVEST IN EMERGING MARKET HEALTHCARE POST-UNITEDHEALTH GROUP
For multinational healthcare firms
Avoid full vertical integration in emerging markets.
Use partnerships or minority stakes.
Price political and currency risk explicitly.
Align operating models with local systems.
For policymakers
Improve regulatory clarity and predictability.
Encourage responsible foreign participation without excessive complexity.
Support digital and preventative healthcare innovation.
For investors
Favor hybrid models combining local ownership with global expertise.
Focus on digital health, telemedicine, and insurtech.
Treat healthcare as a long-term social investment, not a rapid-return asset.
Strategic pyramid of emerging market investment playbook showing asset-light models, partnerships, and regulatory risk pricing.
Bottom Line
UnitedHealth Group’s exit from South America marks a turning point in global healthcare investment strategy. It illustrates the limits of exporting large-scale, U.S. Healthcare models into emerging markets and reinforces the growing importance of local capital, adaptive strategies and flexible investment structures.
FAQ’s: UnitedHealth Group Failure in South America
1. Why did UnitedHealth Group fail in South America
UHG’s capital-heavy, vertically integrated U.S. healthcare model conflicted with regulations, political oversight, currency volatility, and lower-margin emerging market healthcare systems.
2. How much did UnitedHealth Group lose in South America?
UHG incurred over $8 billion in losses, recovering only an estimated 36% of invested capital after divesting its South American operations.
3. When did UnitedHealth Group exit South America?
The phased exit began in late 2022 and was completed in 2025 with the sale of Banmédica in Chile and Colombia.
4. Why did other global insurers succeed?
They used asset-light, partnership-based strategies, reducing capital intensity, regulatory exposure, and political risk.
5.What does this exit mean for emerging market healthcare investment?
It signals a shift toward local partnerships, flexible investment structures, and digital-first healthcare solutions.
A leading global company for Business Solutions , bringing the intriguing global business arena into your space to a business and financial savvy mind.
social media:
Stay In Touch
Don't hesitate. Reach us with these info.
0795046415financialshub01@gmail.comNairobi/Kenya
We create great content everyday. Subscribe to be the first notified when released.
%20(1).png)


.png)


.png)
.png)
.png)

.png)