The 2025 Guinea-Bissau coup, triggered by disputed elections and weak institutions, underscores the country’s chronic political instability. The military takeover has immediate socio-economic consequences and challenges regional governance. ECOWAS and international actors condemned the coup, highlighting broader threats to West African democracy and stability.
Overview of November 2025, Guinea-Bissau's Coup
As of27 November 2025, Guinea-Bissau remained tense and uncertain after a group of army officers announced that they had seized power. The military suspended ongoing electoral process, closed all borders, and imposed an indefinite night curfew.
General elections, both presidential and legislative, were held on 23 November 2025. Almost immediately after voting ended, President Umaro Sissoco Embaló and his main challenger, Fernando Dias, both claimed victory. With no provisional results released and political mistrust running high, tension escalated rapidly.
On26 November,the eve of the expected results announcement, heavy gunfire erupted near key state institutions, including the presidential palace, the national electoral commission headquarters, and the interior ministry. Witnesses reported armed men, some in military uniform, taking strategic positions across the capital. Telecommunications were disrupted as panic spread among civilians (Aljazeera, 2025).
Why Guinea-Bissau's 2025 Coup was successful
The takeover unfolded swiftly due to several structural vulnerabilities:
Historical Instability: Guinea-Bissau’s long-standing coup culture and institutional fragility created fertile ground for military intervention.
Control of Strategic Assets: Reports indicate that high-ranking officers involved in the coup already commanded key military units and critical infrastructure.
Institutional Vacuum:With parliament dissolved and both major candidates claiming victory, no credible civilian authority was positioned to resist the takeover.
Why instability is persistent in Guinea-Bissau
Since independence in 1973, Guinea-Bissau has struggled to maintain stable governance. Until recently, no president had completed a full term peacefully. Chronic instability has been driven by:
Military factions competing for influence.
Entrenched drug-trafficking networks.
Weak state institutions.
Fragmented political parties.
Personalized political rivalry.
These factors repeatedly undermine democratic consolidation.
Timeline of political instability and military interventions in Guinea-Bissau from 1980 to 2025, highlighting coups, mutinies, and election disputes.
Social economic context and implications
Guinea-Bissau is among the least developed countries in the world. The economy is heavily dependent on cashew nuts export (90%) and foreign aid.
Guinea Bissau's Key Economic Indicators:
GDP (nominal): est. USD 2.1 billion (2024); est. USD 2.23 billion (2025).
GDP per capita: est. USD 1,100–1,200 (one of the lowest in West Africa).
Human Development Index (HDI): 0.514 (UNDP, 2023).
Literacy rate: 60–65%.
Electricity access: 30–40%.
Life expectancy: 60–62 years.
Maternal mortality: est. 550 per 100,000.
Infant mortality: 80–90 per 1,000.
Poverty rate: est. 60%.
Bar chart comparing GDP, HDI, and political stability of Guinea-Bissau with Senegal, Guinea, Mali, and Burkina Faso in West Africa.
Key Insights from Bar Chart
Senegal leads in all three metrics: GDP, Human Development Index (HDI), and political stability, indicating stronger socio-economic performance.
Guinea-Bissau ranks lowest across all indicators, reflecting developmental and governance challenges.
Guinea, Mali, and Burkina Faso show moderate GDP but struggle with HDI and political stability, suggesting uneven progress.
Political stability correlates strongly with development outcomes, evident in more stable states like Senegal.
International condemnation: How ECOWAS, UN and Global Powers Responded
The international community has condemned the military takeover:
ECOWAS, AU, and WAEF denounced the coup as an attempt to derail a peaceful electoral process. They demanded the release of detained officials and the resumption of vote counting.
The UN Secretary-General called for restraint and adherence to constitutional order.
The Government of Ghana labeled the coup a “direct assault on democracy,” urging swift restoration of civilian rule.
Qatar called for de-escalation and constitutional governance.
Portugal, Guinea-Bissau’s former colonial power, urged all parties to avoid violence and allow the electoral process to conclude.
The effectiveness of such external pressures remains uncertain for Guinea-Bissau's political maturity.
Immediate Implications: Paralysis, sanctions, and deepening crisis for Guinea-Bissau
Democratic Backsliding: Interrupting an election severely erodes public confidence in democratic processes.
Institutional Paralysis: With parliament dissolved and officials detained, governance has stalled.
Sanction Risks: Suspension from ECOWAS and targeted sanctions.
Loss of Investor Confidence: Lack of Investment flows to the country will likely shrink Guinea-Bissau's economy.
Aid Disruptions: Possible suspension from the IMF, World Bank, Portugal, and UN agencies.
Economic Deterioration: Border closures may worsen inflation, disrupt trade, and create opportunities for drug networks and black-market activities.
Geopolitical winners and losers: Shifting Alliances in West Africa
Foreign powers see an opportunity to protect interests, expand influence or signal support.
France dominates West Africa’s diplomacy, security cooperation, and regional trade. French companies or NGOs may face operational disruption
Russia. Juntas in Mali, Burkina Faso, and Niger have relied on Russian security advisors or logistics support through arm sales.
Gulf States (Qatar, UAE, Saudi Arabia). Gulf states invest in West African infrastructure, ports and energy projects. They fund local media, mosques and charities. They can provide financial or political support to a regime if it aligns with their interests.
West Africa's Coup epidemic crisis in context
The global number for attempted coups is approximately 492 since 1950, with 220 being from Africa,109 of them being successful, and 111 being unsuccessful (VOA, coups in Africa).
45 of the 54 nations across Africa have experienced at least a single coup attempt since 1950. Conversely, there have been no successful coups in richer African countries with strong institutions, such as South Africa and Botswana. West Africa accounts account for more than half of coups in Africa. Sahel, central, east, south and north Africa follow suite respectively.
The frequent coups in West Africa are attributed to:
Colonial legacies and weak institutions. Weak institutions and colonial-era divisions normalized military intervention.
Fragile democracies and disputed elections. Elections and checks on power are often weak or disputed.
Poverty and unemployment. Poverty, unemployment, and corruption fuel dissatisfaction.
Military dominance in politics. Organized militaries see themselves as guardians of the state.
Ethnic and regional divides. Power struggles along ethnic lines create tensions.
External interference and foreign funding. Foreign powers and funding can destabilize governments.
Pie chart showing regional distribution of successful coups in Africa from 1950 to 2023, highlighting West Africa as the most affected region.
Key Insights from Pie Chart
West Africa accounts for 52% of all successful coups in Africa, making it the most politically unstable region historically.
Central Africa follows with 20%, while East Africa has 18%.
Southern Africa and North Africa show significantly lower coup activity at 6% and 4%, respectively.
Case Studies: Niger's transition Vs Kenya's Power Sharing Model
Niger (2010): A military coup eventually led to elections within a year and a return to civilian rule, demonstrating that juntas can, under pressure, transition back to democracy.
Kenya (2007): Electoral violence and political crisis were resolved through mediation and power-sharing,not military intervention, showing how political negotiation can avert conflict.
ECOWAS dilemma: Erosion of authority and path forward
Recent coups in Guinea-Bissau (2025), Niger (2023), Mali (2020 & 2021) and Burkina Faso (2022 & 2023), show that military takeovers are still a persistent problem in West Africa.
This has put ECOWAS on the spot with each new coup testing its enforcement mechanisms like sanctions, mediation or military intervention. Countries like Burkina Faso and Mali have resisted ECOWAS’ interventions in the past, seeking alliances outside the region.
ECOWAS must adapt by:
Strengthening mediation mechanisms.
Enhancing early warning and monitoring systems.
Reinforcing military professionalism and conduct protocols.
Coordinating more effectively with the AU and UN.
Pathways forward for Guinea-Bissau and the region
For Guinea-Bissau:
Strengthen democratic institutions and ensure transparent elections.
Clarify constitutional limits to prevent military interference.
Expand political dialogue and national reconciliation.
Address socio-economic challenges: poverty, unemployment, and corruption.
Implement long-term economic reforms and improve public financial management.
For West Africa:
Invest in governance reform.
Support civil society and independent electoral bodies.
Build resilient state institutions free from military influence.
Key Takeaways from the 2025 Guinea-Bissau Coup: Causes, Impacts, and Regional Implications
The 2025 Guinea-Bissau coup was triggered by disputed election results and weak institutions.
Chronic instability stems from military dominance, criminal networks, and fragmented politics.
The economy faces immediate risks: aid suspension, investor withdrawal, and inflation.
ECOWAS and the international community condemned the coup but have limited leverage.
The event highlights a wider trend of democratic erosion in West Africa.
Frequently Asked Questions: Guinea-Bissau coup
1. Why did the 2025 Guinea-Bissau coup happen?
Because of disputed election results, weak institutions, military influence, and historical instability.
2. How does the coup affect West Africa?
It weakens regional stability, challenges ECOWAS authority, and contributes to West Africa’s growing coup epidemic.
3. What are the economic implications for Guinea-Bissau?
China’s engagement in Africa has expanded dramatically over the past two decades, reshaping economies, trade patterns, and political alliances. As China becomes Africa’s largest trading partner, biggest bilateral lender, and a leading source of technology and infrastructure, understanding the real impact of this relationship is essential.
This analysis examines:
How China builds influence in Africa
What African countries gain
Where trade imbalances create long-term challenges
How investment in minerals, infrastructure, and digital systems strengthens China’s geopolitical presence
China–Africa Trade: Benefits, Imbalances, and Long-Term Risks
Sub-Saharan Africa’s trade relationship with China remains deeply asymmetrical. According to World Bank WITS (2023), Africa imports far more from China than it exports, creating a persistent trade gap.
Key Trade Insights
China exported US$81B to Africa in 2023.
Africa exported US$67.5B to China.
The deficit continues to widen as Africa imports more manufactured goods, machinery, and technology.
Africa’s exports remain dominated by raw materials: oil, minerals, metals, and agricultural commodities
This reinforces Africa’s position as a resource supplier and China’s role as a manufacturing powerhouse, limiting Africa’s ability to move up the value chain.
In contrast, traditional partners such as the United States, the Netherlands, and India maintain significantly smaller trade volumes.
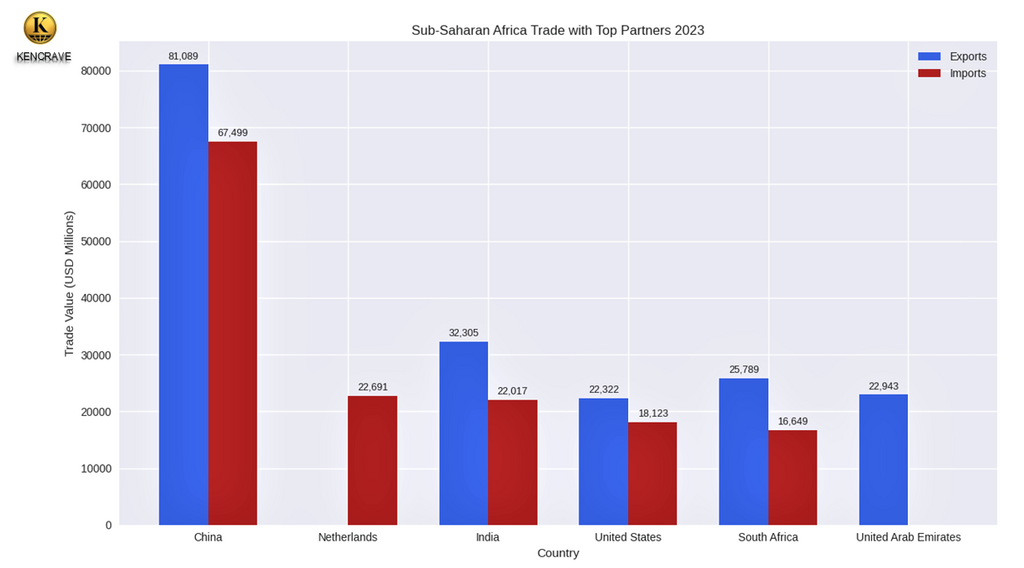
Sub-Saharan Africa trade chart 2023 showing exports in blue and imports in red for China, India, South Africa, United States, UAE, and Netherlands. Source: World Bank
Key Insights from the graph
China: Largest partner, with $81.1B exports vs $67.5B
India: $32.3B exports vs $22B imports → surplus of est. $10B.
South Africa: $25.8B exports vs $16.6B imports → surplus of est. $9B.
United States: $22.3B exports vs $18.1B imports → near balance.
UAE: Export-heavy partner ($22.9B exports), no imports recorded.
Netherlands: Import-heavy partner ($22.7B imports), no exports recorded.
China’s Infrastructure Investments in Africa
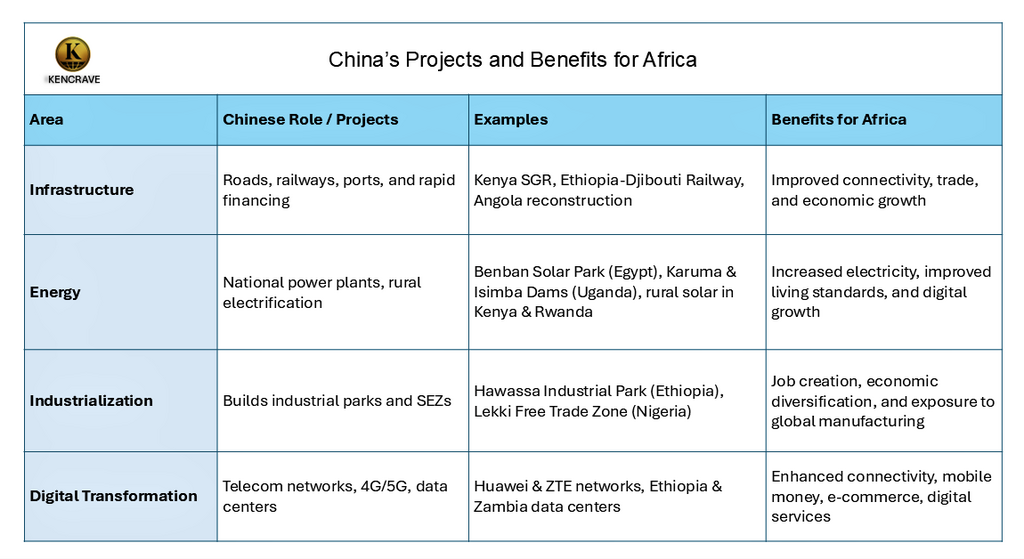
China’s most visible influence comes through infrastructure: roads, railways, ports, power stations, and fiber networks. These projects form the foundation of the China–Africa economic partnership.
Table showing China's signature projects and benefits for Africa.
China’s Strategic Motives: Minerals, Markets, and Geopolitical Influence
China’s engagement in Africa is a calculated strategy to secure economic security and global power, with gains that compound over decades. This strategic approach can be broken down into pillars.
1. Securing Access to Critical Minerals for the Global Energy Transition
Africa is home to some of the world’s most abundant mineral reserves, including those essential for emerging technologies such as electric vehicles, renewable energy, and electronics. China’s involvement in these sectors gives it control over the supply chains of the 21st century.
Democratic Republic of Congo: Chinese companies, through a combination of direct investment and strategic partnerships, now control 80% of the DRC’s cobalt output. This blue-grey metal is indispensable for the lithium-ion batteries that power smartphones and electric vehicles (EVs). U.S. Army War College report, 2024
Guinea: The Simandou iron ore project, one of the world’s largest untapped reserves, is being developed by a consortium supported by Chinese steelmakers, reducing China’s dependence on traditional iron ore exporters like Australia. (IMF Report, 2024)
Access to key minerals enables China to mitigate potential supply shortages, strengthen its dominance in future-facing industries, and maintain significant leverage over global supply chains.
2. Building Long-Term Consumer Markets in Africa
Beyond resources, China recognizes that Africa’s rapidly growing and youthful population represents one of the most attractive long-term markets in the world. Investments are therefore increasingly market-oriented, targeting both mass-market consumers and industrial demand, customizing its products and brands into the fabric of daily African life, including;
Smartphone Dominance: Transsion Holdings, through its brands Tecno, Infinix, and Itel, dominates Africa’s smartphone market. By tailoring devices to local needs (e.g., multi-SIM slots, longer battery life, and affordable cameras), and building brand loyalty among millions of first-time internet users.
Saturation of Consumer Goods: Chinese-made motorcycles have become the backbone of transport and logistics (boda-bodas) in East Africa. Similarly, Chinese solar kits, household appliances, and cheap manufactured goods can be found in different countries in Africa, China Square (Kenya), China Town (Uganda), Kamwala-Lubura Market (Lusaka).
These investments create enduring demand for Chinese products and services, expanding China’s economic footprint while reducing reliance on saturated markets in Europe, North America, and East Asia. This market-driven approach allows China to influence consumption patterns, cultivate long-term brand recognition, and secure future revenue streams.
3.Expanding Diplomatic and Military Influence
Economic presence is seamlessly converted into diplomatic and geopolitical capital. China’s "no-strings-attached" approach to diplomacy, coupled with its structured engagement platforms, fosters political alignment that consistently reinforces Beijing’s global standing.
Diplomatic Alignment in International Fora: The collective support of 54 African nations in bodies like the United Nations is a powerful asset for China. This support often materializes in votes aligning with Beijing’s positions on issues like trade, security, and human rights.
Forum on China-Africa Cooperation (FOCAC): Acts as a platform to announce financing packages, coordinate investment strategies, and consolidate diplomatic influence.
A Strategic Military Footprint: The establishment of China’s first overseas military base in Djibouti opened on August 1, 2017 (Aljazeera), strategically located at the chokepoint of the Bab el-Mandeb Strait, is a clear signal of its intent to secure its commercial interests and protect its citizens and assets abroad.
Through economic diplomacy and infrastructure-backed partnerships, China strengthens its global voice, builds a coalition of supportive states, and gains the ability to protect strategic assets abroad, further consolidating its influence on the international stage.
The Core Imbalance: Africa Gains Short-Term Benefits, China Gains Long-Term Power
While both China and Africa gain, the nature and timing of these advantages differ. From 2000–2022, China’s exports to Africa grew faster than African exports to China, reaching nearly 6% of Africa’s GDP.
Structural Problems
Africa exports raw materials with limited value addition.
Africa imports finished goods creating higher value capture by China.
Infrastructure often includes Chinese operators, equipment, and standards.
Digital networks create technology dependence.
Trade statistics clearly highlight this disparity.
Line graph showing Africa-China trade from 2000 to 2022 as percentage of Africa's GDP, highlighting exports, imports, and trade balance.
Key Insights from the graph:
Africa’s exports to China have grown steadily, but China’s exports have grown faster, leading to a persistent trade deficit.
The trade balance dipped sharply around 2014 and remained negative through 2022.
Using GDP as a reference highlights how significant this trade relationship is to Africa’s economy.
This structure prevents Africa from moving up the value chain and traps it in a classic producer-consumer dynamic, hindering sustainable industrialization.
Strategic Recommendations for Investors and Policymakers
The China–Africa partnership brings both opportunities and risks. Success requires careful planning and smart choices, with a renewed focus on breaking the structural imbalance.
For International Investors & Companies
Focus on Value-Addition: Move beyond simple export of raw materials. Invest in processing plants, manufacturing, and assembly facilities within Africa to help capture more value on the continent.
Forge Equitable Partnerships:Team up with local African companies in joint ventures that mandate genuine skills and technology transfer, not just sub-contracting.
Promote High Standards:Adopt and promote superior environmental, social, and governance (ESG) practices to stand out and build sustainable, community-supported operations.
Invest in Digital Services: Develop software, platforms, and services that build on Africa’s new digital infrastructure and cater to local needs.
For African Policymakers & Governments
Negotiate Smarter, Not Just Harder: Use regional blocs like the African Continental Free Trade Area (AfCFTA) to negotiate collectively. Insist on clauses in contracts that maximize local content, skills development, and technology transfer.
Strategic Industrial Policy:Implement policies that actively protect and nurture infant industries, such as targeted tax incentives for value-addition and temporary, WTO-compliant tariffs on certain finished goods to allow local production to take root.
Manage Debt and Diversify Partners:Conduct rigorous, transparent debt sustainability analyses. Deliberately diversify economic partners to avoid over-reliance on any single nation and create competitive tension.
Invest in Complementary Infrastructure:Prioritize investments in the "soft" and "hard" infrastructure that supports industrialization: reliable energy grids, technical education, and streamlined customs bureaucracy.
For Western and International Policymakers
Offer Competitive, Transparent Financing: Provide faster, less bureaucratic, and more competitive financing options that can serve as a genuine alternative to Chinese loans.
Build Soft Infrastructure and Capacity: Fund programs to strengthen public administration, contract negotiation skills, and project management within African institutions.
Champion Local Innovation: Support partnerships between Western firms and African entrepreneurs to create home-grown solutions, focusing on technology transfer and local IP development.
Key Takeaways:
China is Africa’s largest trading partner and infrastructure financier, a reality that offers both immediate benefits and long-term strategic risks.
The benefits differ in timing and nature: short-term, tangible gains for Africa (infrastructure, jobs) versus long-term, strategic leverage for China (markets, minerals, influence).
The structural imbalance is not merely a trade deficit; it is a cycle reinforced by competitive pressures, tied financing, and internal bottlenecks that hinder Africa's industrial ascent.
Technology and finance reliance strengthen China’s influence, making economic diversification a strategic imperative.
Ultimately, Africa’s future remains in its own hands. With strategic leadership, assertive negotiation, and smart industrial policy, African nations can leverage the China partnership as a stepping stone to independent growth rather than a path to long-term dependency.
Frequently Asked Questions on China’s Influence, Trade, and Investment in Africa
1. What does China gain from investing in Africa?
China gains secure access to critical minerals, expanded export markets, long-term infrastructure contracts, and increased political influence across the continent.
2. Do African countries benefit from China’s involvement?
Yes, Africa gains infrastructure, energy access, jobs, and technology, but China typically earns greater long-term strategic and economic advantages.
3. Why is China Africa’s largest trading partner?
China supplies affordable manufactured goods and finances major projects, while importing African raw materials, creating a high-volume but imbalanced trade relationship.
4. Is China creating debt risks for African countries?
China isn’t deliberately creating debt traps, but many African nations face repayment risks due to project costs, limited revenue, and reliance on Chinese financing.
5. What sectors does China invest in most across Africa?
China invests heavily in infrastructure, energy, mining, telecommunications, and consumer electronics, sectors crucial to Africa’s growth and China’s global supply chains.
A new economic order is emerging from Silicon Valley and Toronto’s AI hubs. North America faces a choice: will it build an intelligent capitalism economy that spreads prosperity fairly, or will a few tech companies control wealth and power, leaving most people behind?
Digital feudalism refers to a scenario where a handful of corporations control critical data, AI platforms, and digital infrastructure, limiting opportunity and concentrating power. The choices made today will shape society, economy, and democracy for decades.
Intelligent Capitalism and the New Drivers of North American Tech Wealth
Wealth creation has shifted from traditional industries to data-driven technology, AI, and software innovation. The U.S. leads in research, technology investment, and unicorn startups. According to PitchBook, U.S. venture capital investment in AI startups reached $50 billion in 2023 alone.
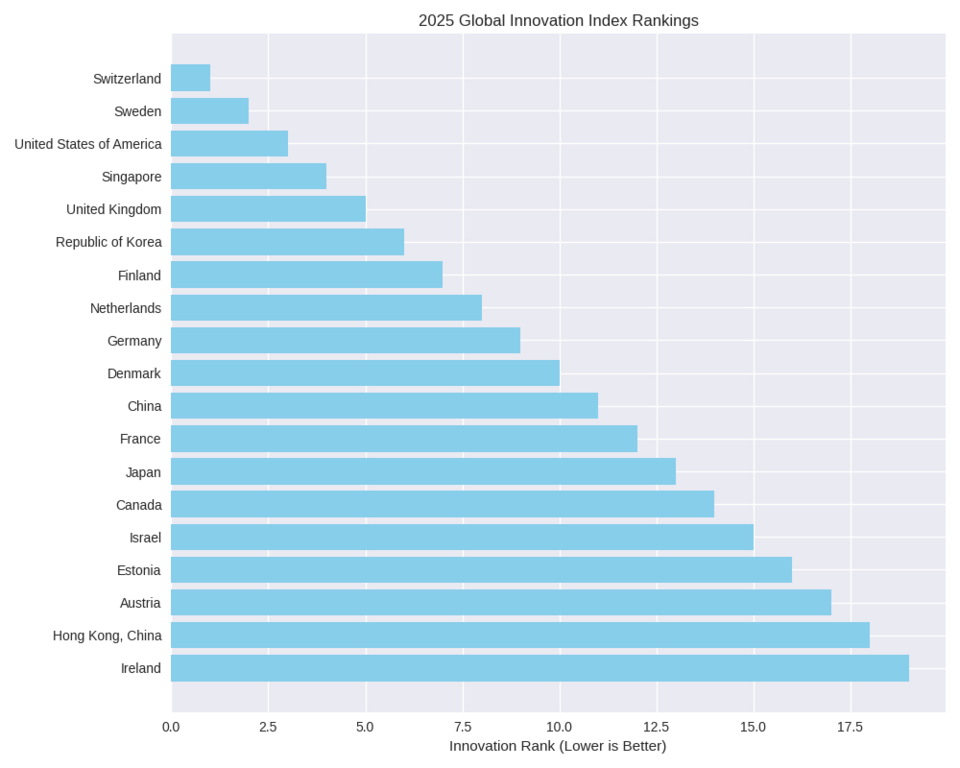
In 2025, North America stood out as the world’s most innovative regions with the US taking third place in the global ranking by Global Innovation Index while Canada contrived to keep position fourteen.
2025 Global Innovation Index ranking chart of top countries including Switzerland, USA, China, and Singapore. Source: Global Innovation Index
Key Highlights from the Chart
Top 5 innovators: Switzerland, Sweden, USA, Singapore, UK.
Asia’s leaders: Republic of Korea (6), China (11), Japan (13), Hong Kong (18).
European strength: Finland, Netherlands, Germany, Denmark, France, Estonia, Austria, Ireland.
North America: USA (3), Canada (14).
Canada’s tech Hubs: Vancouver, Toronto, and Montreal, have become global AI innovation centers. Toronto hosts the Vector Institute, funded by government and private sectors, while Montreal has over 200 AI startups and strong academic partnerships. These hubs are reshaping industries such as healthcare technology, financial services, logistics, and digital entertainment.
Globally, North America competes with:
European Union: Known for ethical AI regulations like the EU AI Act.
China: Investing heavily in AI-driven manufacturing and surveillance.
AI Governance in North America: Risks of a Governance Gap
Technology has advanced faster than regulation. In the U.S., no federal AI law exists; state-level rules create uncertainty. In Canada, 85% of citizens support stronger AI oversight. The Canadian AI and Data Act aims to provide a national framework for AI governance, risk management, and digital accountability.
Failing to close this governance gap risks:
Over-regulation that stifles innovation.
Under-regulation that enables monopolies and public mistrust.
Blueprint for AI and Data Governance: A New Social Contract
North America needs a new approach to govern technology, focusing on four key areas:
Modernize Intellectual Property Rules for AI Innovation: Patent laws should reward new ideas while allowing derivative works, preventing large companies from blocking competition. The IP regimes are central to the fate and future of innovation (International IP Index | U.S. Chamber of Commerce,2025).
Protect Data and Make AI Transparent: Citizens should know how their data is collected and used. Policies should align with frameworks like the EU AI Act, requiring risk assessments and explainable AI in critical systems.
Ensure Fair Workplaces with Algorithm Rules: AI tools in hiring and employee monitoring must be accountable. Pilot programs in Canada test algorithmic impact assessments for public sector hiring.
Prevent AI Monopolies with Pro-Competition Rules: Strong antitrust laws prevent “winner-takes-all” markets and support smaller companies. EU and U.S. cases against tech giants provide guidance for fair digital markets.
The Human Impact of AI and Automation on North American Workforces
The 2025 Global AI Jobs Barometer is indicative of the changing momentum in the workforce. Artificial intelligence is not quite replacing the workforce but rather altering the nature of their roles marginalizing some and making others more valuable. Such roles altered include:
Customer service representatives: Chatbots are being used to conduct routine inquiries as human personnel handle complicated or exclusive problems.
Administrative assistants:Activities such as scheduling, emails sorting, and drafting of documents have been automated.
Data analysts: AI tools are now applied to conduct pattern detections and preliminary data collection. This pushes analysts to focus on interpretation and oversight.
Companies like Amazon, the second largest private employer in the U.S., note AI tools would thin their ranks and a reduction of the headcounts in the years to come owing to the efficient gains from the use of AI. Reskilling programs in AI literacy, data, and critical thinking are essential. The goal is human-AI augmentation, ensuring AI enhances human productivity rather than replacing workers.
AI Wealth Concentration and Equity: Who Benefits from Innovation
In the face of this tech revolution, the question of equity arises as to who truly are the actual beneficiaries of North America’s innovation wave returns.
Much of the wealth created by the tech and innovation engines revolve within the highly skilled and the venture-backed startups, not to forget the large tech firms themselves. This has raised the question of distribution and the flow of the wealth created.
Oxfam reports that the top 1% of Americans captured nearly two-thirds of new wealth created since 2020, largely from tech investments. Without intervention, digital feudalism risks creating a permanent class divide.
Policy solutions include:
Data Dividends: Citizens receive a share of profits from their data (as proposed in California).
Inclusive Investment Programs: Public or citizen-backed investment in startups ensures broader participation.
Social Support Programs: Progressive taxes fund lifelong learning, retraining, and safety nets, including potential basic income.
Feasibility requires political will, public engagement, and careful design to avoid stifling innovation.
The Path Forward for AI and Technology Policy in North America
North America can either:
Move toward digital feudalism, with monopolies, insecure work, and widening inequality.
Build intelligent capitalism, balancing innovation with fairness, investing in workers, and ensuring equitable wealth distribution.
Smart governance, clear policies, and investment in human capital can ensure AI benefits society, not just corporations. The future is shaped by choices made today.
FAQ: North American AI, Automation, and Equity
Q1: What is digital feudalism in North America? A: It occurs when a few tech companies dominate AI platforms and data, limiting opportunities for most people.
Q2: How is AI affecting North American jobs? A: AI automates routine tasks but increases demand for problem-solving, oversight, and human-AI collaboration skills.
Q3: What policies can promote fair AI growth? A: Data dividends, inclusive investment, updated intellectual property rules, fair workplace laws, competition rules, and social support programs.
Q4: How does Canada compare to the U.S. in AI governance? A: Canada focuses on stronger oversight with the AI and Data Act, while the U.S. relies on inconsistent state rules.
Q5: How can North America avoid inequality from AI? A: By building intelligent capitalism that balances innovation with fairness, protects workers, and prevents monopolies.
Canada is entering a decisive decade. As global markets accelerate toward clean technologies, renewable energy, and climate-aligned investment, Canada’s green transition is emerging as both an economic necessity and a strategic opportunity. From Alberta’s oil sands to Quebec’s hydroelectric grid, the country is balancing its identity as a resource powerhouse with its ambition to become a climate innovation leader.
The central question is whether Canada can turn climate ambition into economic advantage while managing regional tensions, regulatory complexity, and rapidly shifting global pressures.
Canada’s Green Transition: Why This Decade Matters
Canada’s energy landscape presents a defining paradox. It holds the world’sthird-largest proven oil reserves after Venezuela and Saudi Arabia. Canada's oil reserves are centered in Alberta, yet provinces like Quebec already run some of the cleanest electricity systems globally, powered largely by hydropower (CAPP).
This duality creates both friction and opportunity.
The federal commitment to reduce emissions 45–50% below 2005 levels by 2030signals a shift toward climate policy as an engine of economic restructuring. The core idea shaping federal strategy is simple: climate action is economic opportunity.
National Climate Policy and Canada’s Net-Zero Strategy
Canada’s nationally determined contribution under the Paris Agreement sets the framework for its net-zero pathway. The federal government’s 2025–26 climate plan emphasizes:
Expansion of clean electricity.
Innovation-driven economic growth.
Resilient low-carbon infrastructure.
These pillars are designed to anchor a competitive net-zero economy.
The Royal Bank of Canada estimates that the transition could generate 235,000–400,000 jobs over the next decade. Labour data from 2022 already identified 327,506 clean-tech manufacturing jobs, underscoring the growing momentum behind Canada’s climate economy.
Clean-Tech Investment and Innovation in Canada’s Energy Economy
A cornerstone of Canada’s clean-energy strategy is rapid innovation and scaling of new technologies. Federal policies aim to expand climate-tech start-ups, boost industrial decarbonization, and grow advanced manufacturing.
Canada’s clean-tech ecosystem benefits from:
Abundant natural resources.
Strong research universities.
Early leadership in carbon pricing.
Access to U.S. and EU markets
These factors position the country to compete in the emerging global clean-energy economy.
Key Federal Incentives Driving Canada’s Clean Energy Growth
Federal investment tax credits are designed to accelerate private capital deployment and strengthen clean-energy competitiveness. Major incentives include:
• 15% Clean Electricity Investment Tax Credit
Supports non-emitting electricity generation, interprovincial grid connections, and modernization of the national grid.
• Expanded Clean Tech Eligibility
Includes small modular reactors (SMRs) and additional low-carbon heat and power technologies. • Over $2 Billion for Critical Minerals
Aimed at scaling production of key inputs for EV batteries, wind turbines, solar components, and energy storage.
• Electric Vehicle Charging Infrastructure Expansion
A nationwide deployment aimed at supporting EV adoption and decarbonizing road transportation. • Clean Fuels Fund
A $1.5-billion federal initiative, extended to 2030, to scale domestic production of clean fuels such as renewable diesel, hydrogen, and sustainable aviation fuel.
These projects strengthen clean-energy supply, create jobs, and support domestic manufacturing.
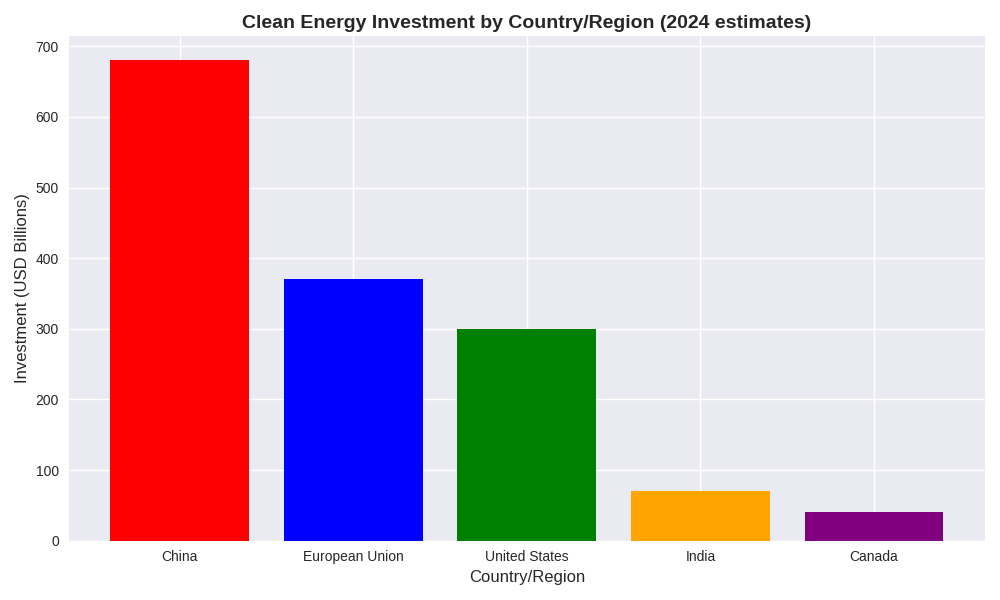
Bar chart comparing 2024 clean energy investments by country - China, EU, USA, India, and Canada.
Key highlights from the graph
China leads with $680 billion in clean energy investment.
European Union follows with $370 billion.
United States invests $300 billion.
India contributes $70 billion.
Canada rounds out with $40 billion.
Regional Conflicts and Industrial Tensions in Canada’s Energy Transition
Despite progress, Canada’s green transition faces significant regional challenges.
Alberta’s Restrictions on Wind Development
Alberta’s decision to restrict wind turbines in specific landscapes and agricultural areas highlights ongoing tensions between traditional energy sectors and emerging renewable industries.
Industrial Legacy vs. Clean Energy Imperatives
Canada must reconcile decades of fossil-fuel infrastructure with the demands of a rapidly evolving clean-energy economy. This tension often shapes political debates, investment decisions, and regional policy differences.
Critical Minerals and Canada’s Role in Global Supply Chains
Critical minerals including lithium, nickel, cobalt, graphite, and rare earth elements, are essential to EVs, batteries, renewable energy systems, and defense technologies.
Canada aims to become a global hub for critical mineral extraction and processing to reduce reliance on China’s dominant supply chains. But challenges remain:
Long permitting timelines.
Environmental assessments.
Indigenous consultation requirements.
Infrastructure gaps in remote regions.
Balancing economic opportunity with environmental and social responsibility is key to Canada’s strategy.
Regulatory Barriers, Governance Risks, and Investment Uncertainty
Predictable regulatory frameworks are crucial for attracting private investment in clean energy. However, Canada’s governance landscape often complicates large-scale project development due to:
Overlapping federal–provincial authority.
Slow permitting and impact assessments.
Inconsistent policy timelines.
Risk-averse public-sector decision-making.
The federal government has proposed strengthened climate-related financial disclosures to improve transparency and align with global standards (Canada Climate Initiative). But implementation remains a major challenge and delays can affect investor confidence.
AI, Energy Demand, and Emerging Risks to the Clean-Energy Transition
Artificial intelligence and large-scale data centers are emerging as significant new stressors on Canada’s electricity system.
Data centers require enormous amounts of electricity and water for cooling. As AI adoption accelerates, Canadian utilities may face energy shortfalls as early as 2027 if supply fails to keep pace with demand.
This creates new risks for the clean-energy transition:
Grid strain.
Increased fossil peaker use.
Delayed decarbonization timelines.
Competition between industries for clean electricity.
Managing AI-related energy demand will be essential to meeting climate goals.
Long-Term Wealth Creation Through Canada’s Clean Energy Economy
Canada’s green transition represents one of the most significant nation-building opportunities of this century. Clean technologies, critical minerals, electrified industry, and low-carbon exports could form the foundation of a new era of national wealth.
But success depends on:
Regulatory predictability.
Infrastructure modernization.
Alignment between federal and provincial governments.
Rapid scaling of clean technologies.
Long-term investment certainty.
Bottom Line
If Canada can turn its climate commitments into executed strategy, it can lead globally in climate innovation and secure a prosperous net-zero future.
The transition to net-zero is an industrial marathon, and Canada stands at a pivotal moment to shape the next generation of national wealth.
Key Takeaways: What Canada’s Clean Energy Transition Means for Its Economy and Net-Zero Future
Canada is using its dual identity as an oil producer and clean-energy leader to fuel a major economic shift toward net-zero growth.
Federal climate policies especially tax credits, clean electricity incentives, and critical-mineral investments, are designed to accelerate clean-tech innovation and job creation.
Regulatory uncertainty, fragmented jurisdiction, and policy delays pose significant risks to clean-energy deployment and investor confidence.
Regional frictions, including Alberta’s restrictions on renewables and Canada’s dependence on global mineral supply chains, threaten the pace of the energy transition.
The green transition represents a long-term wealth-creation strategy for Canada, but only if policy execution aligns with climate commitments and economic targets.
Japan’s new Prime Minister, Takaichi Sanae, has launched a bold strategic pivot, redefining Japan’s role in East Asia through assertive defense spending, ESG recalibration, and a revivalist economic agenda. Her rise marks a historic moment: Japan’s first female prime minister, known for her hawkish stance and tech-forward vision, a contrast to Japan's traditional cautious political style.
A Centralized Leadership Style Replacing Consensus Politics
Takaichi’s policy blueprint, unveiled in October 2025, emphasizes:
Economic stimulus to combat inflation and wage stagnation, including tax breaks for SMEs and digital startups.
Defense modernization, with spending rising to 1.6% of GDP, Japan’s highest since WWII.
Rural revitalization under the “Reiwa Remodeling” initiative, echoing postwar reconstruction.
Her approach contrasts with the consensus-driven style of predecessors like Fumio Kishida, signaling a more centralized and security-focused governance model.
“We will turn people’s anxieties into hope,” she declared in her first Diet address, pledging resilience amid global uncertainties.
Fiscal Pressures Intensify Amid Defense Expansion
Japan’s combination of stimulus spending and defense buildup has raised concerns about fiscal sustainability. With public debt surpassing 250% of GDP, already the highest among advanced economies. Japan must balance growth ambitions with long-term fiscal risks. Expanded security commitments may strain the national budget without parallel reforms or revenue strategies. Regional Power Dynamics Shift as China Watches Closely
China is likely to interpret Japan’s defense surge as alignment with U.S. containment strategies. Beijing may respond by accelerating its own military modernization or intensifying regional pressure campaigns, particularly in the East China Sea.
ESG Progress Highlights Strengths and Persistent Gaps
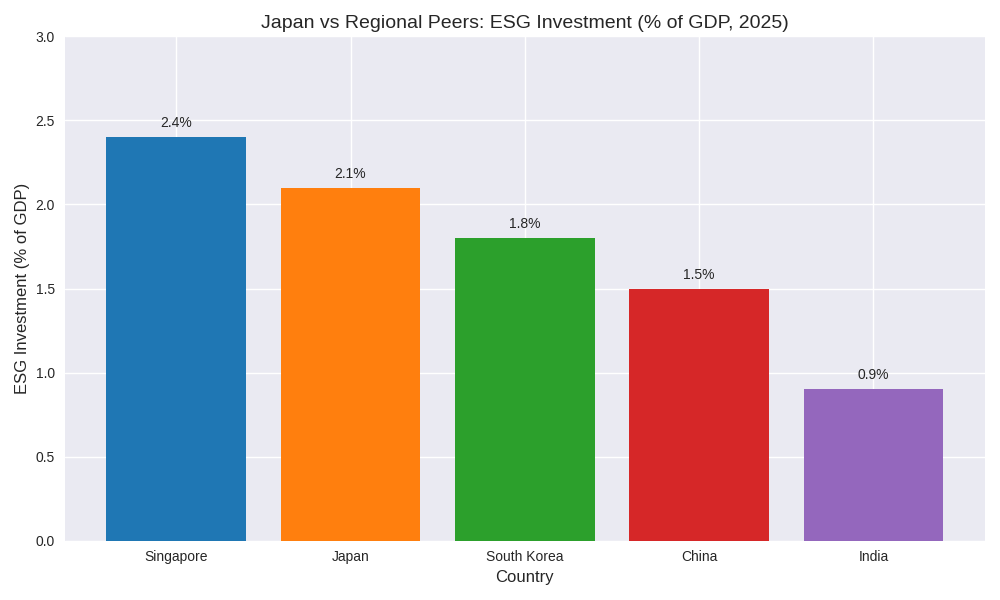
Japan’s ESG investment reached 2.1% of GDP in 2025, reflecting strong government and corporate interest in sustainability. However, regional comparisons reveal a mixed picture:
Bar chart comparing ESG investment as a percentage of GDP in 2025 across Japan, South Korea, China, India and Singapore.
Key Insights from the graph:
Singapore leads with 2.4%, driven by green finance and smart city initiatives.
South Korea follows at 1.8%, emphasizing carbon neutrality and digital equity.
China and India lag behind with ESG efforts constrained by industrial priorities.
Social Inequality Undermines ESG Momentum
While Japan’s ESG agenda prioritizes technology and environmental resilience, social dimensions remain underdeveloped. Gender inequality, limited immigrant integration, and rural-urban disparities highlight cultural blind spots.
ESG reforms are “still fragmented,” says the Tokyo-based Institute for Sustainable Policy.
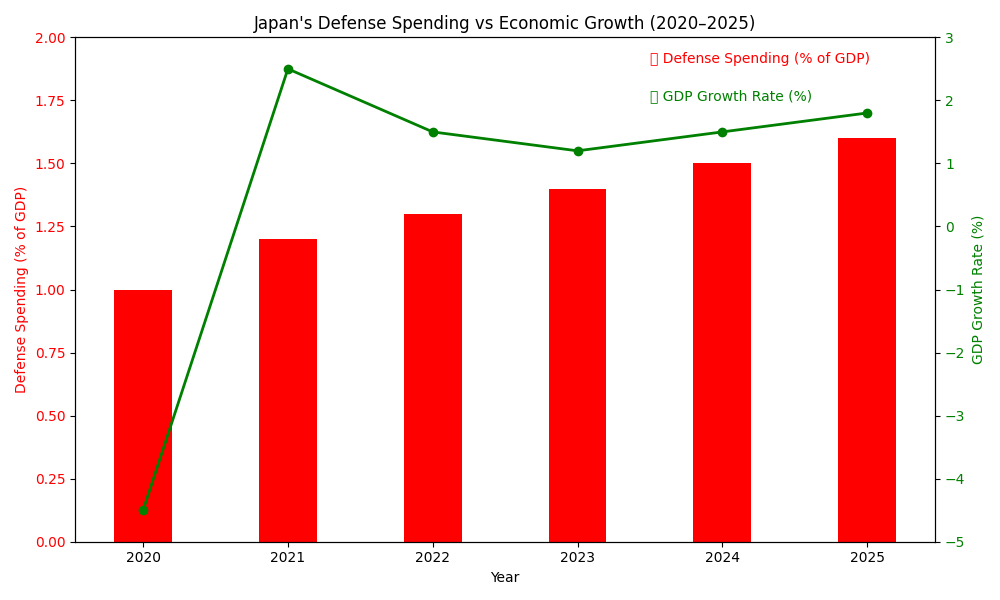
Takaichi’s defense surge coincides with modest economic recovery. The chart below illustrates Japan’s balancing act:
A dual-axis chart showing Japan’s rising defense spending as % of GDP alongside fluctuating GDP growth rates from 2020 to 2025.
Key Insights from the graph:
Japan's Defense spending rose from 1.0% in 2020 to 1.6% of GDP in 2025.
Japan's GDP growth rebounded from -4.5% in 2020 to 1.8% in 2025.
This trajectory positions Japan as a stabilizing force in East Asia, countering assertive moves by China and North Korea while deepening ties with the U.S., Australia, and ASEAN.
“Japan is no longer a passive actor; it’s recalibrating its strategic posture,” notes the Center for Strategic and International Studies.
Immigration Restrictions Remain a Strategic Liability
Japan’s shrinking labor force and intensifying demographic pressures highlight the need for immigration reforms. However, Takaichi’s administration has embraced a more restrictive stance, delaying policy changes that could alleviate labor shortages and support long-term growth. Immigration remains Japan’s most significant strategic blind spot.
Japan continues to confront steep demographic decline, with fertility rates at 1.3 and life expectancy continuing to rise. To counteract population shrinkage, policy solutions may include childcare incentives, controlled immigration expansion, and the adoption of robotics and AI to offset labor shortages. Without decisive action, demographic pressures will compound fiscal and strategic vulnerabilities.
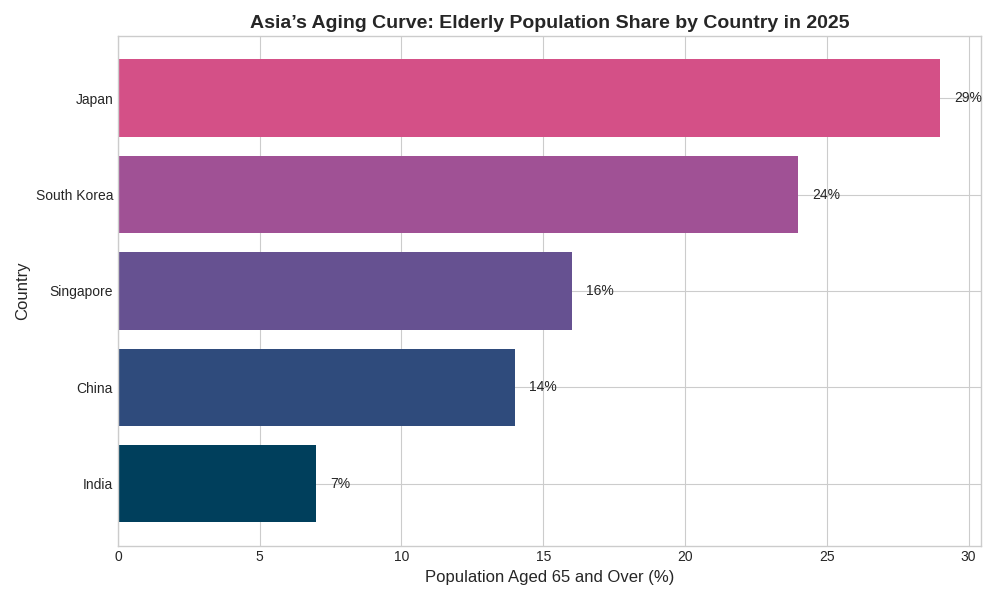
Graph showing aging population in Asia, 2025, from Japan, South Korea, Singapore, China, and India. Source: World Bank
Key Insights - Aging Trends Across Asia
Japan has the highest proportion of elderly population at 29%, indicating significant demographic pressure.
South Korea follows with 24%, also facing major aging-related challenges.
Singapore shows moderate aging levels at 18% and 16%, respectively.
China stands at 14%, reflecting a growing but less acute aging trend.
India has the lowest elderly population at 7%, suggesting a younger demographic profile.
Implications
Countries like Japan and South Korea may need urgent reforms in healthcare, pensions, and labor markets.
India’s youthful population presents opportunities for growth but also demands investment in education and employment.
The data highlights a regional divide in aging intensity, with East Asian economies aging faster than South Asia.
Japan’s Leadership in High-Tech and Green Innovation
Japan leads in advanced robotics (Fanuc, Yaskawa), semiconductors (Renesas, Sony), and green energy technologies (Panasonic, Toyota’s hydrogen initiatives). These sectors thrive due to strong R&D investment, government-industry collaboration, and global demand for precision engineering.
“Japan’s resilience is rooted in its ability to reinvent itself,” says historian Takashi Mikami
Strategic Opportunities and Risks Shaping Japan’s Future
Opportunities: ESG leadership, regional diplomacy, tech innovation, and defense-industrial integration.
“Japan’s future depends on how well it integrates security, sustainability, and social cohesion,” says the Tokyo Policy Forum
Key Strategic Insights and Executive Takeaways
Defense spending has reached its highest level since WWII, strengthening Japan’s military posture and reshaping East Asian power dynamics, prompting likely strategic countermeasures from China.
Fiscal pressures are intensifying, as Japan attempts to expand defense capabilities and stimulate economic growth while managing the world’s highest public debt burden.
Japan’s ESG agenda is advancing but uneven, with strong environmental and governance performance undermined by persistent social weaknesses such as gender inequality, immigration hurdles, and rural-urban disparities.
Demographic decline and restrictive immigration policies pose long-term structural risks, limiting labor supply, productivity growth, and the sustainability of Japan’s economic and defense ambitions.
Japan’s technological leadership remains a core strength, with global competitiveness in robotics, semiconductors, and green energy positioning the country for strategic advantage despite internal challenges.
Europe’s accelerating AI investment boom is creating significant ripple effects across the European bond market, increasing bond spreads, raising credit risk, and contributing to financial volatility. As tech companies expand AI infrastructure, including data centers, semiconductors, and cloud systems, corporate debt levels are rising, creating concerns about long-term refinancing and profitability (Financial Times).
Why AI Spending Is Increasing Bond Spreads in Europe
Capital-Intensive AI Infrastructure Is Driving Higher Credit Risk
Europe’s push to remain competitive with the U.S. and China in artificial intelligence has triggered a surge in spending on:
hyperscale data centers
semiconductor manufacturing
AI cloud infrastructure
energy-intensive compute resources
These investments require large upfront capital financed through corporate debt, increasing perceived default and refinancing risk.
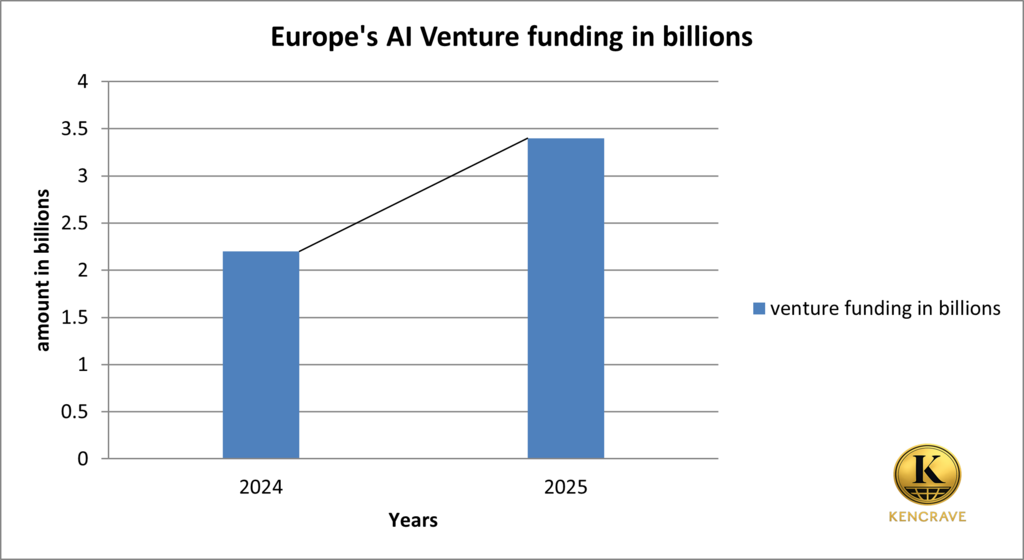
In Q1 2025, AI venture funding in Europe increased by 55%, while total 2025 funding reached $5.32B.
Europe's AI venture funding growth chart 2024 to 2025 – a bar graph showing a billion-dollar increase. Source: Silicon Canals
Geopolitical Risk and Energy Fragility
The war in Ukraine, EU political divergence, and energy-market fragility have led investors to demand higher risk premiums,especially in Italy, Spain, and other peripheral markets.
ECB Interest Rates Are Delaying Relief
With inflation near 2%, the European Central Bank (ECB) has slowed rate cuts, keeping corporate refinancing costs high. This has pushed bond yields up and prices down, particularly for companies making aggressive AI infrastructure investments.
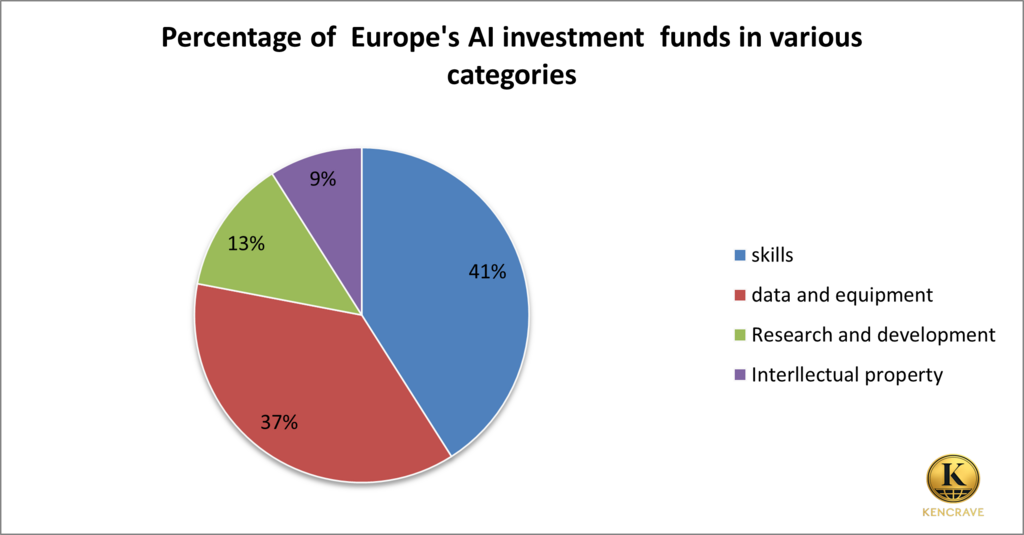
Europe's Sectoral AI Investment
According to OECD (Organization for Economic Co-operation and Development):
71% from private sector funding
Europe AI investment fund allocation pie chart – skills, data, R&D, intellectual property. Source: OECD
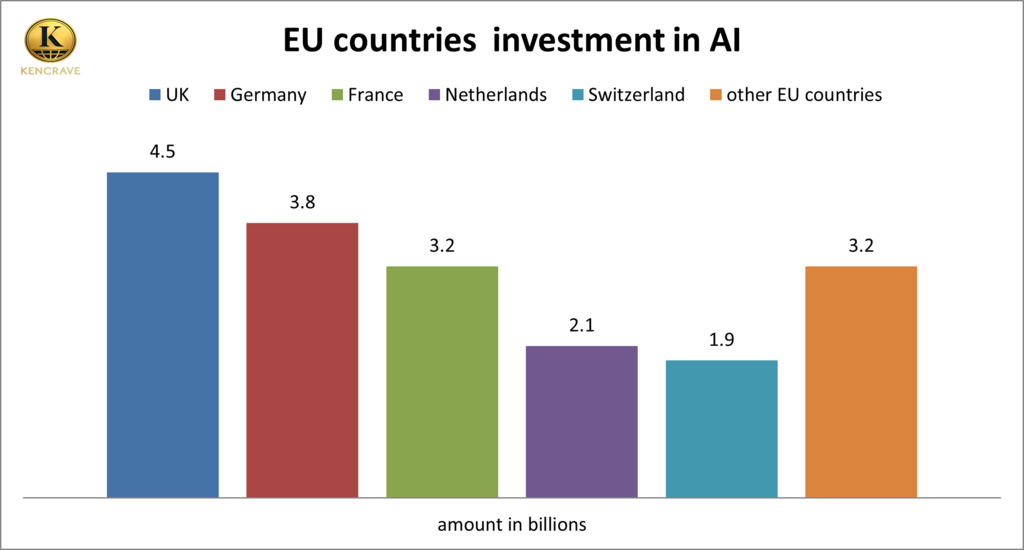
Top contributors in Europe's AI Investment:
UK – 24%
Germany – 20%
France – 17%
Netherlands – 11%
Switzerland – 10%
Other European nations – 18%
These nations lead in both AI R&D and AI financing capacity.
EU countries AI investment comparison chart – UK leads with €4.5B, followed by Germany, France, Netherlands and Switzerland.
Financial Stability Effects on Europe
Exposure to U.S. Tech Corporate Bonds
Many European investors whether it is banks, pension funds or insurers hold corporate bonds from U.S. tech giants like Microsoft, Alphabet and Meta because they are considered safe investments. European balance sheets take a hit when bond prices fall since they are among the largest foreign holders of U.S. corporate debt. This means European capital markets feel the shock almost instantly as portfolio risk increases.
This affects solvency ratios and long-term returns for institutions that millions of Europeans depend on.
Higher Borrowing Costs for European Firms
Higher spreads make borrowing more expensive for European corporates as well. Companies competing in AI and adjacent technologies might delay projects or be forced to slow down research and development spending due to raised financing costs.
Energy Demand and ESG Complications
Building large-scale AI infrastructure increases energy demand significantly. This challenges Europe’s green transition objectives and affects energy pricing. This adds another layer to AI investment of environmental and regulatory compliance risk that furthers the uncertainty.
Macroeconomic Implications of AI-Driven Bond Market Instability
The instability observed in European bond markets due to uncertainty surrounding the future of AI investment carries broader macroeconomic implications that extend beyond the technology sector.
Credit crunch and slower growth: Widened bond spreads translate into higher borrowing costs across the corporate sector for not only tech firms but also small and medium enterprises. Financing becomes more expensive, causing banks to tighten their lending standards, causing a reduction in investment, slows job creation, and delays overall economic growth.
Weakened consumer confidence and spending: Bond market volatility creates a perceived higher economic and financial risk to consumers, and they tend to cut back on spending and increase precautionary savings. Lower consumption further weakens economic momentum.
Fiscal Pressure on Governments: Higher risk premiums raise sovereign borrowing costs, particularly in already vulnerable eurozone economies. This increases debt servicing burdens and limits governments’ ability to fund strategic public investments.
Setbacks to strategic EU initiatives: Instability in capital markets threatens the financing of key EU programs such as the Digital Europe Program, Europe’s semiconductor strategy, and the Green Deal Industrial Plan. Delays in these initiatives widen the investment gap and undermine Europe’s competitiveness in emerging technologies.
Increased vulnerability to external shocks: European investors are significant holders of U.S. tech bonds, thus global market swings can quickly transmit into European balance sheets. This increases volatility, heightens market fragmentation, and raises the risk of contagion across both corporate and sovereign debt markets.
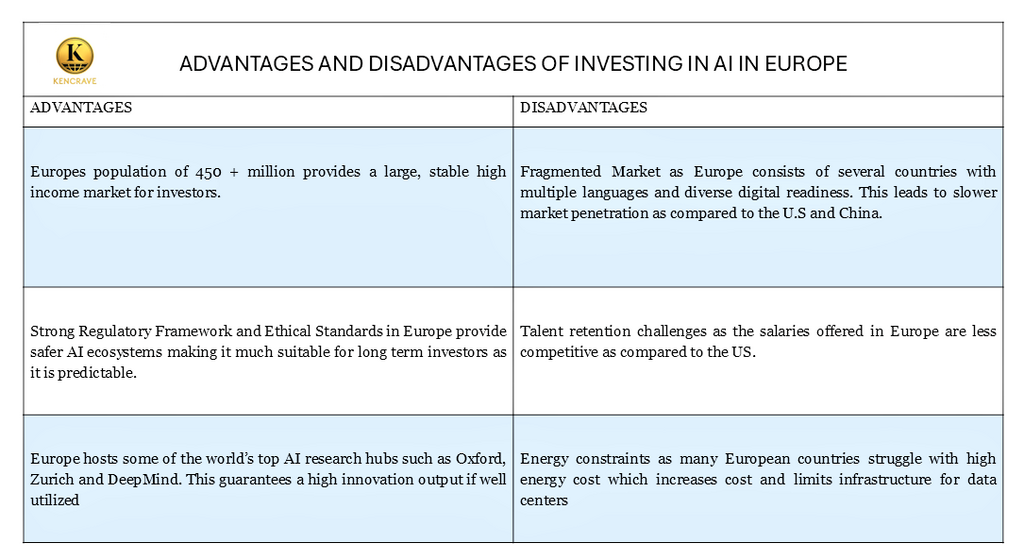
Advantages and Disadvantages of AI Investment in Europe
Advantages and disadvantages of investing in AI in Europe in terms of market size, regulation, talent, and energy.
The advantages position Europe as an attractive environment for long-term AI investment. However, the disadvantages amplify innovation risk, which translates directly into AI credit risk.
High capital expenditure and dependence on energy infrastructure mean investors demand a higher risk premium, thus contributing to the widening bond spreads observed in major AI tech companies operating in Europe.
Europe’s AI investment landscape is shaped by a dual reality: strong structural strengths supporting innovation, and systemic constraints that elevate uncertainty in financial markets.
Leading AI Regulators in Europe
European Union. The EU AI Act, which came into force in August 2024, is the most comprehensive regulatory framework for governing artificial intelligence in the region. Member states are required to designate national AI authorities to enforce the AI Act (EU Artificial Intelligence Act, 2024).
Germany. Germany’s AI strategy is well developed. The country is aligning its national plans with the EU’s regulatory framework while simultaneously investing in AI R&D. Germany played a key role in negotiating the EU AI Act alongside France and Italy.
France. The French government has set up the Generative Artificial Intelligence Committee to guide policy for high-risk and frontier AI models. It advocates for a strong but balanced EU regulatory regime, pushing for rules that protect fundamental rights without stifling European innovation.
Italy. Italy has been particularly active in shaping EU-level regulation. It joined Germany and France in forming common ground on AI Act negotiations. Italy is positioning itself to both regulate and drive innovation.
Spain. Spain created the Spanish Agency for the Supervision of Artificial Intelligence (AESIA) in September 2023, making it one of the first EU countries with a dedicated AI watchdog. The Spanish national AI strategy aligns closely with EU regulations while promoting innovation in SMEs and public-sector AI.
Denmark. Denmark has launched a national regulatory sandbox, open to both public bodies and private firms, to test AI systems and navigate compliance with the General Data Protection Regulation.
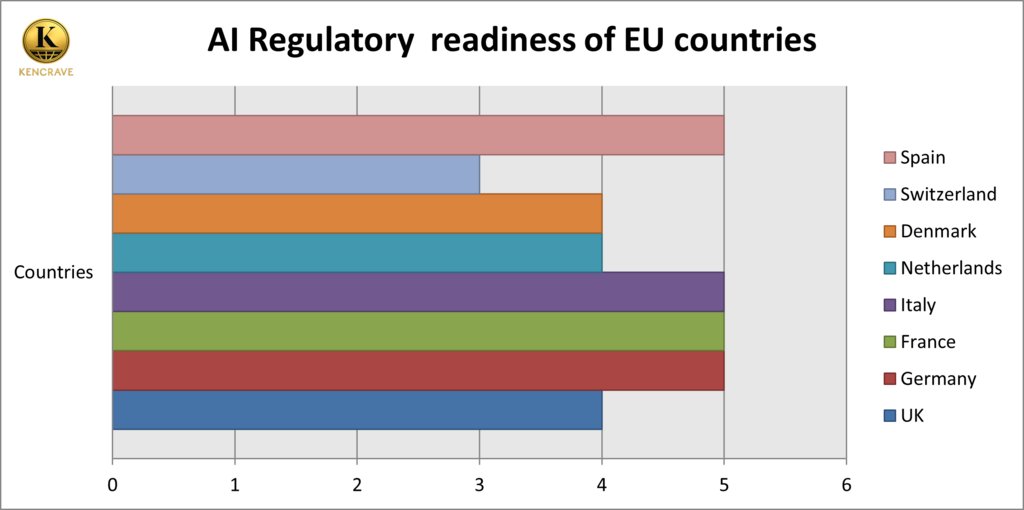
EU countries regulatory readiness chart – comparative scores for AI governance across Europe
Key Measurements:
5 = Dedicated AI authority + early enforcement + strong national AI strategy
4 = Strong regulatory frameworks but still building full enforcement capacity
3 = Aligned with EU Act, but moderate progress
2 = Partial readiness
1 = Minimal readiness
Policy and Investment Recommendations
1. Europe Should Support Strategic AI Investment
Europe can strengthen its AI leadership by expanding targeted public-private investment strategies that reduce dependence on foreign technology providers and improve long-term financial stability.
How:
Channel more capital into local cloud infrastructure, semiconductor manufacturing, and high-performance AI computing facilities through EU-backed funds and national investment banks.
Increase R&D funding for universities and cross-border research hubs to accelerate innovation and reduce technological reliance on the U.S. and China.
Provide tax incentives and grant programs for companies building AI data centers, chips, and energy-efficient compute infrastructure, lowering financing risk and long-term debt pressure.
2. Europe Should Align AI Growth With Energy Stability
Because AI infrastructure is highly energy-intensive, Europe must ensure that AI expansion does not undermine climate goals or energy security.
How:
Scale renewable energy investments (wind, solar, hydropower) and modernize grid capacity to support rising data center loads.
Promote long-term Power Purchase Agreements (PPAs) for AI and cloud providers to stabilize energy pricing and reduce exposure to energy market volatility.
Implement ESG-aligned regulatory frameworks to guide responsible AI deployment and encourage compliance with emissions, efficiency, and sustainability standards.
3. Investors Should Strengthen Portfolio Resilience
Investors must account for the dual nature of Europe’s AI landscape: strong innovation potential but elevated credit and refinancing risk.
How:
Evaluate AI adoption rates and ecosystem maturity when assessing long-term profitability and growth potential in European AI markets.
Monitor regulatory environments, especially the EU AI Act, to anticipate compliance costs, innovation constraints, and competitive positioning.
Incorporate energy cost projections, geopolitical risks, and refinancing pressures into credit models to better predict bond spread movements and identify vulnerabilities within AI-related corporate debt.
A leading global company for Business Solutions , bringing the intriguing global business arena into your space to a business and financial savvy mind.
social media:
Stay In Touch
Don't hesitate. Reach us with these info.
0795046415financialshub01@gmail.comNairobi/Kenya
We create great content everyday. Subscribe to be the first notified when released.

%20(2).png)
.png)
.png)
.png)