Asia Market Outlook 2026 points to a cautiously risk-on environment in early Q1, supported by easing inflation, resilient exports, and policy-managed stability across China, Japan, and South Korea. This Asia macro outlook highlights selective strength in Asian equities, particularly AI and semiconductor supply chains, alongside contained FX volatility, with the yen softening and the offshore yuan (CNH) capped. Overall, the Asia equity outlook remains constructive but uneven, with performance increasingly driven by policy signals, FX dynamics, and sector-specific fundamentals rather than broad beta.
Asia Macro Outlook
The macro environment leaned cautiously risk-on, supported by easing inflation pressures across East Asia and resilient export flows despite lingering global trade frictions. According to the World Bank’s January 2026 Global Economic Prospects, East Asia and Pacific growth held near 4.8% in 2025, with China at 4.9%, buoyed by fiscal stimulus and consumption resilience. J.P. Morgan’s Asia Outlook 2026 highlighted AI-driven industrial buildouts in China, South Korea, and Taiwan as structural tailwinds for semiconductors and technology.
Asia Equity Market Outlook
Equity markets reflected this resilience: the Nikkei 225 extended gains on domestic demand optimism, while the Shanghai Composite stabilized after property-sector stress. Southeast Asian indices (Vietnam, Indonesia) showed selective strength, benefiting from supply-chain diversification.
Currency markets remained steady, with the CNH capped by cautious capital flows, while the yen softened modestly amid BOJ’s gradual policy normalization. Credit spreads across Asia stayed contained, reflecting confidence in disinflation and policy support.
Sector Leadership
Technology & semiconductors: Outperformance in Korea and Taiwan on global AI demand
Consumer discretionary: Recovery in China, supported by stimulus
Financials: Stable, though property-linked exposures weigh on sentiment
Defensives: Utilities and staples resilient in Japan and ASEAN markets
Key Drivers Ahead for Asia Market Outlook
China PMI releases, BOJ policy signals, and regional inflation prints will test whether optimism sustains into Q1. Sentiment momentum will remain sensitive to policy communication and FX stability.
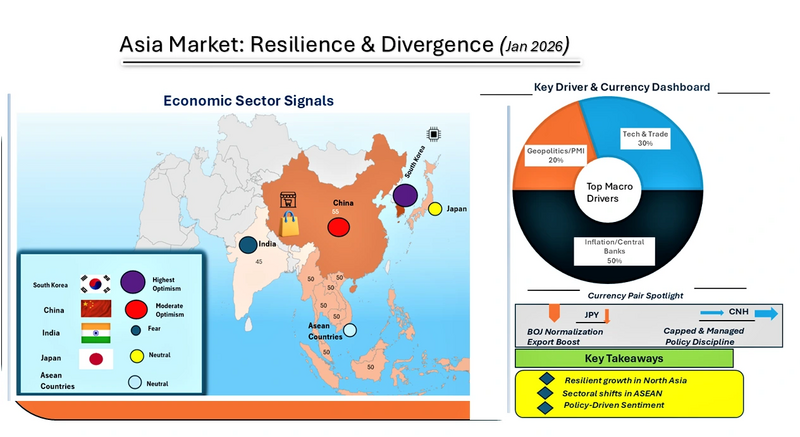
Visual Summary: Asian Macro Drivers (Focus Allocation)
Inflation prints (CPI/PPI): 25%
Central bank decisions (BOJ, PBOC, RBI): 25%
PMIs & industrial data: 20%
Tech/semiconductor earnings: 20%
Credit spreads/liquidity: 10%
Asia macro drivers Jan 2026 pie chart showing inflation, central bank decisions, tech earnings, PMI data, and credit spreads.
Inflation data and central bank policy dominate sentiment formation, while PMIs and tech earnings reflect Asia’s manufacturing resilience and AI-driven growth. Credit conditions remain a stabilizing, secondary factor.
Asia Fear & Greed Index Snapshot
China: 55
Japan: 50
South Korea: 60
India: 45
ASEAN (Vietnam, Indonesia): 50
Asia Fear and Greed Index Jan 2026 bar chart comparing investor sentiment in China, Japan, South Korea, India, and ASEAN.
Optimism is strongest in South Korea on semiconductor momentum, moderate in China, neutral in Japan/ASEAN, and cautious in India due to inflation pressures and capital flow sensitivity.
Asia FX Outlook: Yen and CNH Dynamics
Softened Yen
Supports Japanese export competitiveness (autos, electronics)
Raises import costs for energy/raw materials
Signals BOJ normalization path, tempering regional bond risk appetite
Increases hedging demand for ASEAN corporates with yen exposure
Capped CNH (Offshore Yuan)
Reflects managed capital flows and volatility control
Supports confidence in China’s policy discipline
Constrains offshore liquidity and arbitrage flows
Reduces FX volatility for regional trade partners
Trade Implication (Directional, Non‑Prescriptive)
The market environment favors targeted risk-taking rather than broad market exposure. Technology and semiconductor companies in North Asia especially in South Korea and Taiwan, are better positioned to outperform, supported by strong AI investment and resilient exports. Japanese equities also benefit in the near term from a weaker yen, which supports exporters.
By contrast, property-related financials and highly indebted cyclical sectors remain vulnerable. Across the region, the more attractive opportunities are in export-focused manufacturing and AI infrastructure, while a cautious approach to currencies and credit remains appropriate, as gradual policy tightening and managed capital flows are likely to limit sharp upside moves.
Asia Market Surprise Risk to Monitor
Asia Market Surprise Risk to Watch
AI Investment Slowdown If global spending on AI infrastructure slows more than expected due to weaker earnings, tighter regulations, or large tech companies pulling back on investment, it would quickly hurt semiconductor companies in South Korea and Taiwan and their suppliers.
This would weaken the current positive outlook for the sector, likely causing investor sentiment to turn negative, credit conditions in tech to worsen, and money to move back into more defensive and domestically focused sectors. Asia Market Outlook 2026: Scenario Framework (Next 1–3 Months)
Base Case (est. 60% probability)
Asia’s market outlook remains cautiously positive. Inflation continues to ease and central banks are tightening policy slowly and carefully. In China, government stimulus is helping consumer spending and keeping growth stable without fueling another property boom.
Investment in AI is supporting earnings growth in South Korea and Taiwan, while Japan benefits from a weaker yen without aggressive interest rate hikes from the Bank of Japan. Equity markets are rising gradually in selected areas, credit conditions remain stable, and currency markets are relatively calm.
Bull Case (est. 25% probability)
If global demand improves more than expected and policymakers communicate more clearly, investor confidence would rise. Consumer spending in China would strengthen further, manufacturing data across North Asia would improve, and investment in AI would last longer than currently expected.
At the same time, the yen could weaken further without policy surprises, supporting Japanese stocks. Increased capital inflows would lift equity markets across the region and improve credit conditions, allowing Asia to outperform other emerging markets thanks to stronger growth visibility and leadership in technology.
Bear Case (est.15% probability)
If policymakers send mixed signals or an unexpected external shock occurs, investor confidence could quickly weaken. A pullback in AI spending, renewed stress in China’s property sector, or sudden swings in the yen or offshore yuan could push stock markets lower and worsen credit conditions.
In this environment, investors would likely shift money into safer U.S. dollar assets, causing Asian equities to underperform and driving a rotation toward more defensive and domestically focused sectors.
Key Takeaways: Asia Market Outlook 2026 Q1
Resilient Growth Amid Global Frictions. East Asia’s steady GDP growth and China’s stimulus underpin regional stability despite trade tensions.
Policy-Driven FX and Sentiment . Softened yen and capped CNH anchor currency stability, while sentiment is strongest in South Korea and most cautious in India.
The United States is undergoing a supply chain realignment, driven by global disruptions, geopolitical tensions, and the need for greater systemic resilience. An era defined by cost-focused globalization and just-in-time models prioritized efficiency at the expense of resilience (The World Economic Forum, 2020).
As reported by Al Jazeera in 2021, events like the COVID-19 pandemic and the 2021 Suez Canal incident exposed the risks of depending on distant, centralized supply chains. These crises revealed that low cost and speed were insufficient, prompting a strategic resurgence of priorities like stability, security, and oversight.
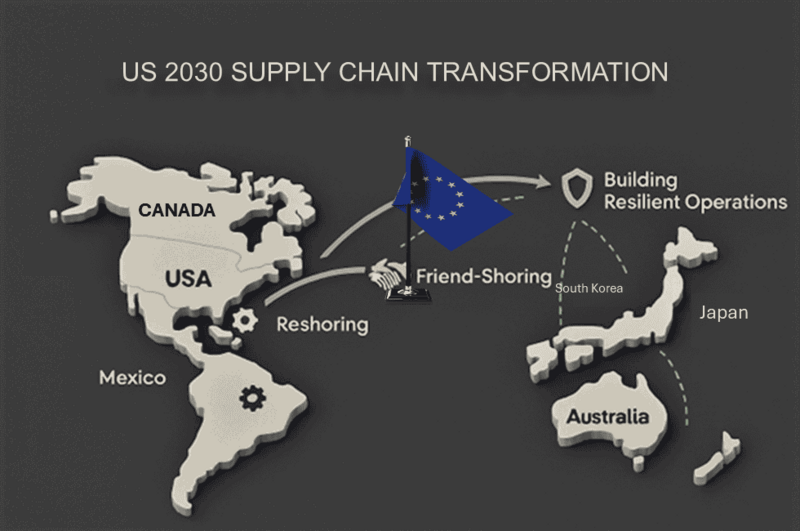
This transformation is now widely described as the US Supply Chain Transformation. It marks a move away from hyper-globalized sourcing toward a more regional, diversified, and politically aligned production system. Understanding how this transformation emerged and how it is being executed is essential for businesses, policymakers, and investors navigating the next phase of global trade.
From Just-in-Time Efficiency to Systemic Fragility
For decades, the dominant supply chain model relied on just-in-time production. Goods moved from Asian factories to US markets with minimal inventory and precise scheduling. The system reduced costs and boosted margins, but it assumed stable geopolitics, predictable transportation, and uninterrupted global trade.
Pandemic-related factory shutdowns, port congestion, container shortages, and record freight rates broke delivery timelines. The Ever Given incident alone delayed nearly $10 billion in trade per day (Bloomberg, 2021). These shocks exposed the risk of relying on single-region manufacturing for essential goods such as semiconductors, pharmaceuticals, and consumer staples.
What emerged was not a temporary disruption, but a structural failure. Firms and governments began to reassess supply chains as strategic assets rather than cost centers.
What Defines the US Supply Chain Transformation
The US Supply Chain Transformation is a coordinated shift led by both public policy and corporate strategy. Its objective is to reduce dependence on single-source overseas manufacturing, particularly in China, by diversifying production locations and shortening supply lines.
Three approaches define this transition.
Reshoring focuses on bringing manufacturing and critical supply chains back to the United States.
Nearshoring shifts production to geographically close partners, primarily Mexico and Canada.
Friend-shoring relocates supply chains to countries with strong political alignment, trade ties, and stable institutions.
These strategies form the backbone of a more regional and risk-aware supply chain model.
The Forces Driving the Transformation
Several forces made the old model unsustainable.
Geopolitical Tensions and National Security: The US-China trade conflict highlighted the vulnerability of relying on a strategic competitor for semiconductors, rare earths, and pharmaceuticals (The New York Times, 2025). The war in Ukraine exposed the risk of relying on adversarial countries for resources.
High Cost of Supply Chain Distribution: During the pandemic, delays and freight price spikes erased decades of cost savings from global sourcing. OECD data shows that logistical breakdowns outweighed efficiency gains, forcing businesses to reassess total supply chain cost rather than unit price alone.
Push for Resilience: Companies began shifting toward just-in-case approaches by holding safety stock, adding backup suppliers, and diversifying production footprints. Predictability and shock absorption replaced marginal cost optimization.
Government Legislation: Government policy accelerated the shift. The CHIPS and Science Act of 2022 provides over $52 billion to boost domestic semiconductor production. The Inflation Reduction Act of 2022 introduced tax credits for clean energy, electric vehicles, and battery production within North America.
Consumer and Investors Demand: Consumer and investor expectations also evolved. Buyers and investors increasingly value supply chain ethics, sustainability, and reliability. Firms with visible, local, and resilient operations gained reputational and strategic advantages.
The 3 Strategies of the Supply Chain Transformation
1. Reshoring and the Return of Domestic Manufacturing
Reshoring is rebuilding US industrial capacity after decades of offshoring. Investment is concentrated in advanced manufacturing, semiconductors, clean energy, and electric vehicles (Tech News World, 2025).
Major chipmakers are leading the trend. Intel is expanding fabrication plants in Arizona and building a large-scale semiconductor hub in Ohio. TSMC is constructing a multi-fab campus in North Phoenix. Samsung is developing a major semiconductor complex in Texas that combines production and research.
These projects strengthen intellectual property protection, create high-skilled jobs, and reduce exposure to global logistics shocks. They also face constraints. Labor costs are higher, and the supply of skilled manufacturing talent remains limited.
2.Nearshoring: The “China +1” Strategy
Nearshoring is among the most popular and scalable supply chain strategies, with Mexico being the primary beneficiary (Boston Consulting Group, 2024). Companies are adopting a China +1 model. They maintain Asian production for global markets while shifting US-focused output to Mexico. This approach helps reduce risk without a complete exit from Asia.
Key Structural Advantages of Mexico:
Proximity enables faster and cheaper truck and rail transport.
The USMCA trade agreement provides tariff-free access and regulatory predictability.
Shorter transit times reduce inventory risk and improve responsiveness.
As a result, Mexico has become a critical node in North American manufacturing, particularly for automotive, electronics, and consumer goods.
3.Friend-Shoring and Trusted Supply Networks
Friend-shoring adds a geopolitical dimension to supply chain design. Production is relocated to countries with strong diplomatic ties, stable governance, and aligned economic interests (The World Economic Forum, 2023).
Each partner plays a specific role. Canada supplies critical minerals. Japan and South Korea provide advanced electronics and battery technology. Australia supports lithium and raw material supply. India offers an alternative manufacturing hub with scale and growth potential.
The result is a distributed but trusted network that reduces exposure to political pressure and trade disruption.
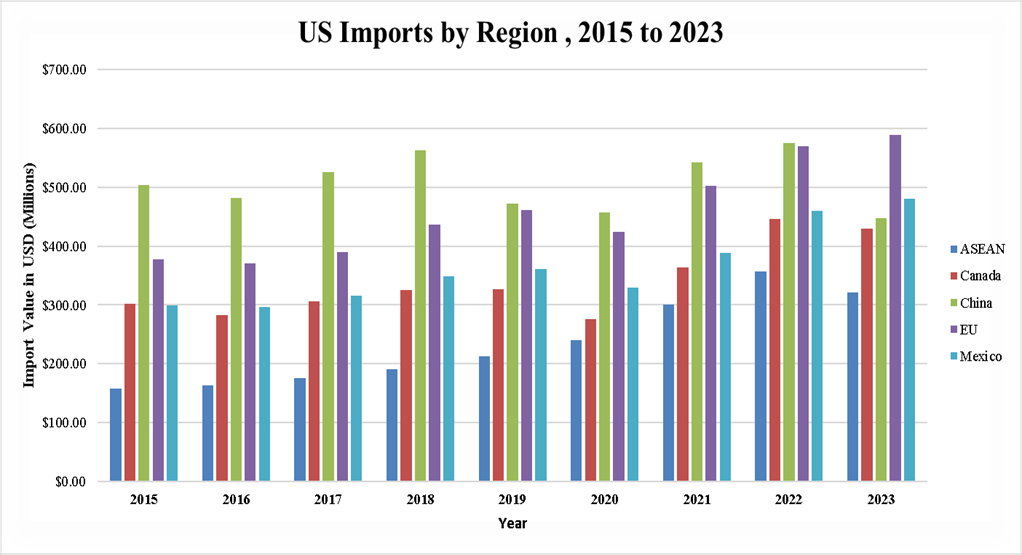
Bar chart showing US imports from major partners (ASEAN, Canada, China, EU, Mexico) from 2015–2023, highlighting shifts in trade volumes and diversification trends.
Key Insights from the US Import Trends by Region (2015–2023)
China’s share of US imports peaked in 2018 at $563 billion but fell to $448 billion by 2023, reflecting efforts to reduce dependence on a single source.
Mexico’s imports rose steadily from $299 billion in 2015 to $480 billion in 2023, highlighting its role as a nearshoring partner.
Canada remains a stable supplier, with imports increasing from $302 billion in 2015 to $430 billion in 2023, peaking at $447 billion in 2022.
ASEAN imports more than doubled, from $157 billion in 2015 to $321 billion in 2023, showing broader Southeast Asian sourcing.
EU imports grew from $378 billion to $589 billion, reflecting continued reliance on advanced machinery, pharmaceuticals, and high-value goods.
Implications: The US is actively diversifying supply sources, reducing reliance on China, strengthening nearshoring in Mexico, and broadening partnerships with ASEAN and EU countries to support supply chain resilience.
The Infrastructure and Technology Enablers
The supply chain transformation depends on modern infrastructure and advanced technology. For companies to rebuild a more resilient system, they have to upgrade the tools and the networks that support it.
Workforce Development: The new supply chain model depends on experts in logistics analysis, robotics, and advanced manufacturing. Investments in such areas help build a workforce that supports long-term growth.
Digital Supply Chains: Companies are deploying AI to forecast demand and spot risks early, IoT sensors to track goods in real time, and cloud platforms to connect every stage of production and transport. This transition increases supply chain transparency and operational agility.
Physical Infrastructure: The Bipartisan Infrastructure Law of 2021 allocates roughly $1.2 trillion between 2022 and 2026 to upgrade roads, rail, ports, and logistics corridors needed to handle increased domestic and regional freight.
Economic and Strategic Implications
The supply chain shift is already shaping the US economy, business decisions, and consumer expectations.
The US Economy With this shift, the growth of high-skilled, high-wage jobs in manufacturing will increase, and there will be reduced dependencies on adversaries for essential goods, strengthening national and economic security. Funding is flowing into regions that are building new factories, technology centers, and logistics hubs, creating momentum for industrial growth across the country.
Businesses The shift brings lower long-term risk but higher upfront costs. Production costs in the US, Mexico, or allied countries are higher, yet they protect businesses from long delays and shutdowns. Businesses must build partnerships with suppliers in Mexico, the US, and allied countries. To stay competitive, they will have to invest in advanced technologies that provide visibility across the chain.
Consumers Some products may cost more because of higher production costs, but with minimal shortages during crises and better availability trade-off. Consumers will have access to goods made in the US, which often come with confidence in quality and labor standards.
Strategic Risks and Critical Implementation Challenges
Systemic Strategic Risks
Geopolitical and Alliance Risks
Friend-shoring assumes long-term political alignment. This is not guaranteed. Leadership changes, trade policy shifts, or regional instability can weaken alliances over time. Overreliance on a narrow group of allied partners can recreate concentration risk under a different label.
Export controls, sanctions, or diplomatic disputes may still disrupt critical inputs such as semiconductors, critical minerals, or energy components.
Economic and Market Risks
Reshoring and nearshoring increase fixed costs. If global demand slows or inflation persists, higher cost structures can compress margins and reduce competitiveness.
Firms that restructure supply chains during economic downturns risk stranded assets if projected demand does not materialize. Currency volatility and interest rate fluctuations also affect cross-border investments in Mexico, Canada, and allied economies.
Execution and Timing Risks
Supply chain transformation is capital-intensive and slow. Semiconductor fabs, battery plants, and logistics hubs take years to reach scale. If execution lags behind geopolitical or market shocks, firms may remain exposed during the transition period. Poor sequencing of investments can lead to capacity bottlenecks, underutilized assets, or missed market windows.
Core Implementation Challenges
Workforce and Talent Pipeline
Advanced manufacturing requires engineers, technicians, data analysts, and automation specialists. The current US labor market does not supply these skills at a sufficient scale. Training pipelines lag capital deployment. Without coordinated investment in technical education, apprenticeships, and immigration pathways for skilled labor, new facilities will face chronic understaffing and lower productivity.
Cost Competitiveness and the Business Case
The U.S. based and allied manufacturing struggles to match Asia on unit cost. Energy prices, labor costs, and regulatory compliance raise production expenses. The business case for reshoring depends on valuing resilience, reliability, and risk reduction. Many firms still lack internal frameworks to quantify these benefits, making investment decisions harder to justify to shareholders focused on short-term returns.
Strategic Recommendations
For Policymakers and US Institutions
Align industrial policy with workforce strategy. Capital subsidies must be matched with funding for technical education, community colleges, and apprenticeship programs tied directly to new manufacturing projects.
Build redundancy into trade policy. Avoid concentrating friend-shoring incentives in a narrow set of countries. Broaden alliances across regions to prevent new single points of failure.
Accelerate permitting and infrastructure delivery. Delays in zoning, environmental reviews, and grid access increase execution risk and discourage private investment.
Standardize resilience metrics. Develop national frameworks for measuring supply chain risk so firms can incorporate resilience into financial decision-making.
For Multinational Corporations
Adopt portfolio based supply chain design. Balance cost-efficient global sourcing with regional redundancy rather than pursuing full reshoring or full globalization.
Invest in digital visibility. Real-time tracking, scenario modeling, and supplier risk analytics are now core operating capabilities, not optional upgrades.
Build long-term supplier partnerships. Stability comes from co-investment, shared data, and joint contingency planning with suppliers in Mexico, the US, and allied economies.
Quantify resilience value. Incorporate downtime risk, revenue loss, and reputational impact into capital allocation models.
For Investors
Reprice resilience. Favor firms with diversified sourcing, regional manufacturing footprints, and strong supply chain governance.
Target infrastructure and enablers. Logistics, grid modernization, industrial real estate, and supply chain software benefit directly from regionalization trends.
Assess execution capability. Capital alone is insufficient. Management teams with proven experience in large-scale industrial projects will outperform.
Take a long-horizon view. Returns from reshoring and friend-shoring accrue over years, not quarters.
Regionalization as the Dominant Supply Chain Model
The US Supply Chain Transformation is shaping a future built on predictable operations and regional networks. The shift away from hyper-global systems is permanent. Businesses are moving toward a structure that balances production across the United States, nearby trade partners, and trusted allies.
The goal is to create a supply chain that supports long-term growth and withstands disruption. Workforce and costs remain challenges, but they do not change the overall path. The priority now is strength and stability, not the lowest possible price. Resilience-centered supply chain design is now a core determinant of long-term US commercial and industrial competitiveness.
Key Takeaways
The US supply chain model is shifting from cost minimization to risk minimization.
Reshoring, nearshoring, and friend-shoring now define industrial strategy.
Government policy is actively reshaping manufacturing geography.
Mexico and allied economies are gaining lasting strategic importance.
Companies that invest early in supply chain visibility and redundancy will outperform.
Supply chain resilience is now a competitive advantage, not a contingency cost.
Frequently Asked Questions: US Supply Chain Transformation
1. What is the US Supply Chain Transformation?
The US Supply Chain Transformation is a shift toward reshoring, nearshoring, and friendshoring to reduce supply chain risk, improve resilience, and protect national and economic security.
2. Why is the US reshoring and nearshoring manufacturing?
The US is reshoring and nearshoring to reduce dependence on China, limit exposure to geopolitical risk, shorten supply lines, and prevent disruptions like those seen during the COVID-19 pandemic.
3.What is friend-shoring in supply chains?
Friend-shoring is the practice of relocating supply chains to politically aligned countries with stable institutions to reduce trade risk and ensure reliable access to critical goods.
4. How does supply chain regionalization affect businesses?
Regionalized supply chains increase resilience and reliability but raise production costs, requiring firms to invest in automation, digital visibility, and diversified supplier networks.
The conflict between the United States and Venezuela, particularly in 2025 and 2026, has escalated to a point where both military and economic consequences are becoming increasingly significant on the global stage. This escalation began after the US seized a Venezuelan oil tanker, citing violations of sanctions, and deployed significant military assets to the Caribbean. Tensions continue to rise as both nations struggle over control of oil resources and respond to political maneuvering.
The Capture of Venezuelan President Nicolás Maduro: US Military Operation and Political Fallout
Maduro’s capture marked a turning point in the ongoing conflict between the U.S and Venezuela.
The capture not only reshaped Venezuela’s internal power dynamics but also sent shockwaves across the international community. For the rest of the world, such development of Venezuela's President Maduro, raises questions about sovereignty, interventionism, and the precedent it sets for global geopolitics.
Looking ahead into 2026, Venezuela’s political environment is likely to undergo profound shifts. The removal of Maduro creates both opportunities and uncertainties:
Domestic Transition: Competing factions within Venezuela may vie for control, potentially leading to either a fragile interim government or intensified instability.
Regional Impact: Neighboring Latin American states will be forced to recalibrate their diplomatic and economic ties, with some welcoming the change and others condemning the intervention.
Global Consequences: Major powers such as Russia and China are expected to respond strongly in different fronts, framing the capture as a challenge to multipolarity and international law.
Future Outlook: For Venezuela, 2026 could be marked by contested elections, economic restructuring attempts, and heightened social unrest as citizens grapple with uncertainty about the nation’s trajectory.
Understanding the Monroe Doctrine’s Influence on US-Venezuela Relations: A Historical and Geopolitical Perspective
The Monroe Doctrine has played a central role in shaping US foreign policy toward Latin America, including Venezuela. The Monroe Doctrine has been used to justify US interventions, and its relevance in the 2025-2026 US-Venezuela.
What the Monroe Doctrine Is
Origin (1823): Introduced by President James Monroe, the doctrine warned European powers against further colonization or interference in the Americas.
Core Principle: The Western Hemisphere was to remain under US protection, with any external meddling seen as a threat to US security.
Evolution: Initially defensive, it later became a justification for US dominance and intervention across Latin America.
How It Has Been Used to Justify US Interventions
19th–20th Century: Invoked during interventions in Cuba, Panama, and Central America to block European influence and secure US economic interests.
Cold War Era: Used to counter Soviet presence in the region, reinforcing US hegemony.
Modern Examples: Interventions in places such as Grenada (1983) and Panama (1989) were framed under Monroe Doctrine logic.
Relevance in the 2025 - 2026 US - Venezuela Conflict
Revival of the Doctrine: President Donald Trump explicitly cited the Monroe Doctrine to justify the capture of Nicolás Maduro, portraying Venezuela’s ties with foreign adversaries as a violation of hemispheric security.
Strategic Justification: The doctrine was reframed as a “Trump Corollary” or “Donroe Doctrine,” emphasizing unilateral US action to secure its sphere of influence.
This framing transforms the Venezuela crisis 2025 - 2026from a sanctions dispute into a doctrine-driven confrontation.
Global Fallout and Regional Impact:
Latin American states are divided, with some supporting the US stance and others condemning it as neo-imperialism.
International Response: Russia and China criticized the move, arguing it undermines sovereignty and international law.
Future Outlook: Venezuela’s political environment in 2026 is expected to remain volatile, with contested leadership and heightened geopolitical tensions.
US-Venezuela Military Dynamics: An Uneven Power Balance
The US military holds a clear technological and numerical advantage over Venezuela, but Venezuela has developed asymmetric defense strategies to counteract this imbalance.
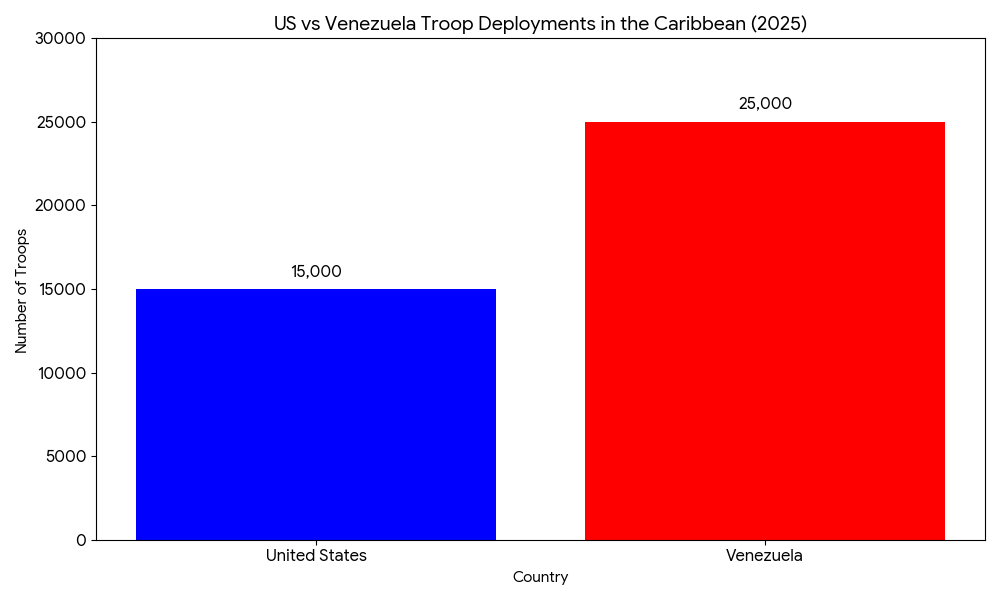
US vs Venezuela military power comparison Caribbean 2025 chart, troop deployments, naval assets, air power analysis.
Troop Deployment in the Caribbean
While the US has a significant advantage in troop numbers and military technology, occupying Venezuela would come at a high cost.
US vs Venezuela Caribbean troop deployments 2025 bar chart, military presence comparison, Venezuela 25,000 vs US 15,000 troops.
Internal Political Dynamics: US and Venezuela’s Domestic Constraints
The internal political landscapes in both the US and Venezuela will play a crucial role in the escalation of this conflict. In the US, Congress would likely be a key decision-maker regarding military action. Public opinion, especially in the context of US foreign policy fatigue, could push for a more cautious approach.
In Venezuela, the unification of the military behind Maduro’s regime is a critical factor. While Maduro retains substantial support, particularly among the military, dissent and unrest could undermine his authority, especially in the face of prolonged external pressure.
The Role of Regional Bodies: Implications for Global Governance
Regional organizations like the UN and the Organization of American States (OAS) have the potential to influence the conflict's trajectory. These bodies will likely be involved in diplomatic efforts to mediate and de-escalate the situation, but their ability to enforce peace could be limited.
The involvement of global powers and the lack of consensus on Venezuela within the international community complicate the role of these organizations.
Economic and Geopolitical Impact: The Consequences of Escalation
Oil Market Disruptions and Industry Repercussions
Venezuela’s vast oil reserves make it a key player in global energy markets. The conflict has the potential to disrupt Venezuela’s oil production, which would push global oil prices higher. Given that Venezuela is a major supplier, particularly to countries like China, any disruption would have wide-reaching consequences.
Impact on Major Global Players
China As a major oil importer from Venezuela, China is likely to feel the effects of any disruption in oil supply. This could further strain its energy security efforts, especially given its growing demand for energy and the importance of stable oil imports for its economy.
Iran Iran, which shares some geopolitical interests with Venezuela, could also face significant implications. Any disruption in Venezuela’s oil production could further exacerbate the already strained energy market. As an oil-exporting nation, Iran may see its position in the global market shift, especially if oil prices rise significantly, leading to changes in its own energy exports and relations with other oil-importing nations.
Global Financial Markets As oil prices rise, stock markets in oil-importing nations, particularly in Europe and Asia, would face volatility. Investors would need to brace for oil price spikes and currency fluctuations, especially in emerging markets that rely heavily on oil imports. Increases in oil prices could lead to inflationary pressures, impacting businesses and consumers alike.
Implications for Industries
A disruption in oil exports from Venezuela could severely impact industries dependent on stable energy prices, including manufacturing, transportation, and energy production. Furthermore, insurance premiums for shipping and oil-related businesses could see significant increases due to the heightened risks in the region.
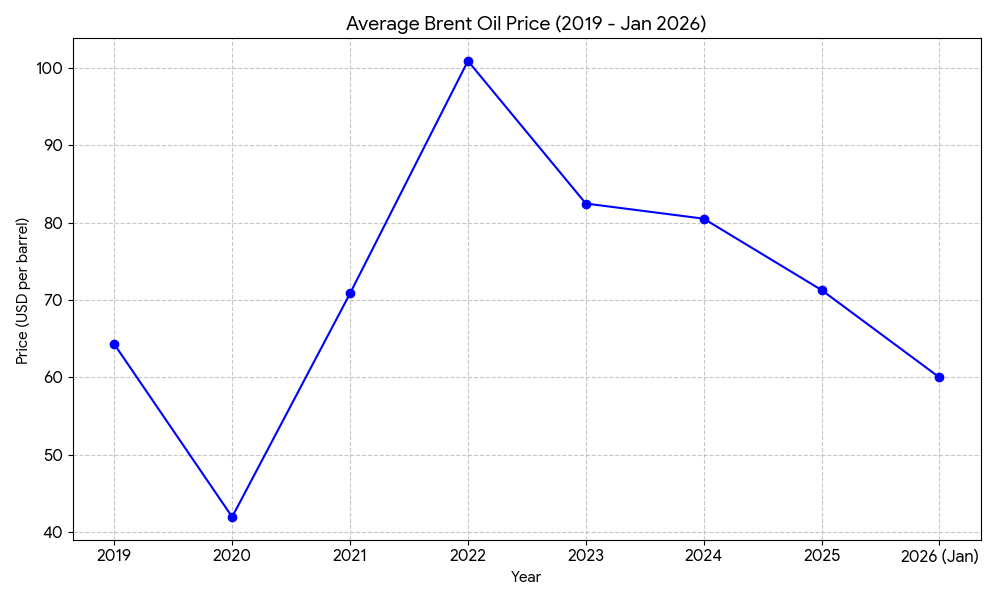
Average Brent oil price 2019–2026 line chart, global crude market trends, pandemic slump, 2022 peak, and 2025 decline. Sources: Statista and US EIA
Key Insights from the Chart
2019–2020: Prices fell from estimate of $64 to $42 due to the COVID‑19 pandemic and global demand collapse.
2021–2022: Strong rebound, peaking at estimated $101 in 2022, driven by supply constraints and geopolitical tensions (including Russia–Ukraine war).
2023–2024: Stabilization around estimated $80–83, reflecting partial recovery and OPEC+ production adjustments.
2025: Decline to estimated $71, showing easing demand and oversupply pressures.
2026 (Jan): Prices trending lower (estimated $60), suggesting weaker global demand and increased production capacity.
Risks
Short-term: Venezuela’s instability could cause sudden price spikes, especially if production halts.
Medium-term: Even with declining Brent averages in 2025–2026, geopolitical shocks from Venezuela could reverse the downward trend.
Long-term: Energy security calculations increasingly factor Venezuela’s reserves, meaning regime stability will remain a critical variable for global oil markets.
Implications to Industries and Sectors
1.Energy-Intensive Industries at Risk: Sectors like aviation, manufacturing, and logistics face rising operational costs and reduced margins.
2.Inflationary Pressures Globally: Higher oil prices contribute to inflation, especially in import-dependent economies across Africa, Asia, and Europe.
3. Geopolitical Leverage for Oil Exporters: Countries like Iran benefit from elevated prices, potentially reshaping global alliances and trade flows.
4.Investor Strategy Shift: Investors may pivot toward energy stocks, commodities, and geopolitical risk hedges, while avoiding vulnerable sectors.
Geopolitical Fallout: Regional and Global Implications
The US-Venezuela conflict would have significant geopolitical repercussions, including:
Migration Pressures: A full-scale war could exacerbate the already severe migration crisis, especially toward neighboring countries like Colombia and Brazil. The millions of Venezuelan refugees would place immense pressure on regional resources and infrastructure.
Geopolitical Realignment: Venezuela’s growing ties with China would likely intensify, complicating US foreign policy. China may increase its support for Venezuela, further challenging US diplomatic and economic strategies.
Energy Security: Europe and Asia could face renewed volatility in oil imports, with Venezuela's role in the global energy market being key. A prolonged conflict could affect energy supply chains and increase energy security risks worldwide.
Caribbean Economies: Countries in the Caribbean heavily reliant on tourism and shipping would face significant economic challenges due to military escalation and the potential for collateral damage in the region.
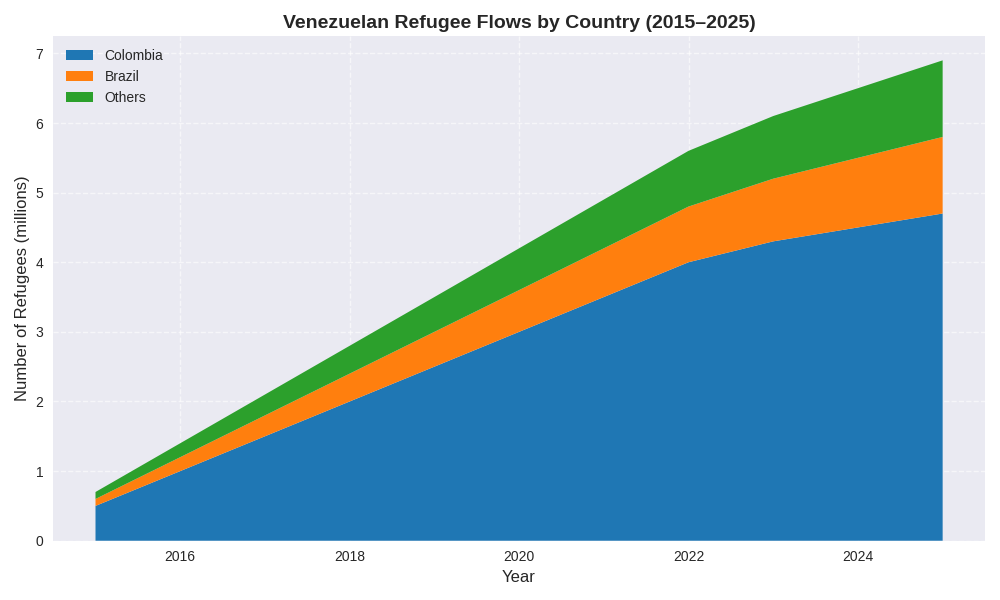
Stacked area chart of Venezuelan refugee flows illustrating migration pressures on Colombia, Brazil, and other countries.
Key Insights from the Chart
Steady Growth in Refugee Numbers: The total number of Venezuelan refugees has consistently increased from 2015 to 2025, reaching nearly 7 million by the end of the period.
Colombia as Primary Destination: Colombia has absorbed the largest share of refugees throughout the decade, indicating its central role in regional humanitarian response.
Brazil’s Rising Burden: Brazil’s intake has grown steadily, especially after 2020, suggesting increased migration pressure and potential strain on public services.
Diversification of Destinations: The “Others” category shows a gradual rise, implying that Venezuelan refugees are increasingly seeking asylum in a broader range of countries beyond immediate neighbors.
Implications
Regional Strain: Colombia and Brazil face mounting challenges in housing, healthcare, and employment for refugees, which may destabilize local economies and politics.
International Humanitarian Demand: The growing refugee numbers call for expanded support from global institutions like UNHCR, IOM, and donor nations.
Migration Policy Pressure: Neighboring countries may tighten border controls or revise asylum policies, potentially leading to humanitarian bottlenecks.
Global Governance Test: The scale and persistence of the crisis underscore the need for coordinated international action and burden-sharing mechanisms.
The Stakes Ahead
The US–Venezuela conflict of 2025-2026 is no longer just a bilateral dispute; it has become a flashpoint with far-reaching economic and geopolitical implications. Businesses, policymakers, and regional governments must prepare for oil market volatility, disrupted trade routes, and increased migration flows. While a negotiated settlement remains possible, the prevailing trend suggests that the conflict will continue to simmer, posing significant risks to global stability.
Key Takeaways from the US-Venezuela Conflict in 2025
1. Military Imbalance: The US has superior military capabilities, but Venezuela’s reliance on asymmetric tactics presents serious challenges to a US occupation.
2.Oil Market Volatility: Disruptions in Venezuela’s oil production could significantly impact global oil prices and affect major players like China.
3. Economic Impact on Regional Economies: Caribbean economies, particularly in tourism and shipping, are vulnerable to the ongoing military buildup and potential conflict.
4. Migration and Humanitarian Crisis: A full-scale conflict could worsen the Venezuelan refugee crisis, with neighboring countries like Colombia and Brazil bearing the brunt.
5.Geopolitical Realignment: Venezuela’s growing ties with China add a layer of complexity to US foreign policy, further influencing the conflict’s dynamics.
1. What are the primary causes of the US-Venezuela conflict in 2025?
The conflict is driven by disputes over oil resources, drug trafficking accusations, sanctions enforcement, and contested elections. Covert US operations have further escalated tensions.
2. How will the US military’s involvement impact Venezuela’s defense?
While the US has superior military technology, Venezuela relies on asymmetric defense strategies, including missile systems and coastal defenses, to counterbalance the US advantages.
3. What effect will the conflict have on global oil prices?
Any disruption to Venezuela’s oil production could significantly raise global oil prices, affecting global markets and industries dependent on stable energy costs.
4.How will the Venezuelan refugee crisis evolve during the conflict?
A full-scale war would likely accelerate migration flows, especially towards neighboring Colombia and Brazil, placing immense pressure on regional economies and humanitarian resources.
5. What role does China play in the US-Venezuela conflict?
China has strong ties with Venezuela and is expected to deepen its support, complicating US foreign policy and adding a layer of global geopolitical tension.
Tensions between Japan, China, and Taiwan have intensified sharply in recent years. Once managed through careful diplomacy and strategic ambiguity, security issues are now expressed through public rhetoric, military signaling, and economic responses. Recent comments by Japanese leaders about a potential Taiwan conflict drew strong reactions from Beijing, highlighting the risks to regional stability and East Asia security.
These developments are part of a larger transformation in East Asia: the decline of post–Cold War restraint, the emergence of hard security blocs, and the use of economic coercion as a gray-zone strategy. Taiwan sits at the center of this evolving strategic landscape, both as a deterrent and a potential vulnerability.
Japan-Taiwan Security Stance: Shifting Rhetoric and Policy
Prime Minister Sanae Takaichi’s statement calling a potential Chinese attack on Taiwan “survival-threatening” for Japan marks a shift from Japan’s historically cautious approach to Taiwan. Under Japan’s 2015 security legislation, Tokyo may act in collective self-defense if a Taiwan contingency threatens its southern islands.
This shift reflects both structural changes and domestic pressures. Political leaders are increasingly willing to challenge postwar taboos due to China’s growing military capabilities and expectations from the United States. Japan’s rhetoric is part of a broader effort to define its strategic identity, moving from strategic ambiguity to strategic clarity, even at the risk of provoking China.
Internal Debates in Japan, China, and Taiwan
The current tensions are not uniform; each country faces internal debate that shapes policy:
Japan: Takaichi represents a hawkish perspective, but parties like Komeito and parts of the bureaucracy worry that strong commitments on Taiwan could draw Japan into conflict or violate postwar principles. Public opinion shows concern about China but reluctance for military engagement.
China: Hardliners push for accelerated action on Taiwan, while economic technocrats warn against escalation that could harm growth or invite sanctions.
Taiwan: The ruling Democratic Progressive Party favors alignment with Japan and the U.S., while opposition parties fear becoming a central target. Public opinion increasingly supports self-defense but prefers avoiding escalation.
These internal differences create opportunities for moderation but also risks of miscalculation. Strategic Theory: Deterrence, Ambiguity, and the Security Dilemma
Japan frames its statements as defensive deterrence, while China interprets them as hostile. This classic security dilemma illustrates how one country’s efforts to increase security can prompt countermeasures by others.
For decades, Taiwan’s stability relied on strategic ambiguity. Japan’s recent language contributes to strategic clarity, strengthening deterrence but narrowing diplomatic space and increasing escalation risks. The challenge is maintaining deterrence without crossing into perceived encirclement.
China Economic Strategy: Response to Japanese Rhetoric
China condemned Japan’s statements, raised the dispute at the United Nations, and warned that any foreign military intervention in Taiwan would be considered aggression against China.
In 2025, Beijing also applied economic coercion measures: suspending Japanese seafood imports and discouraging Chinese tourism to Japan. These actions show China’s preference for gray-zone economic strategies, allowing signaling of resolve without triggering direct conflict.
Military Balance and Regional Vulnerabilities
Beneath diplomatic posturing, military realities are shifting. China continues to expand anti-access and area-denial capabilities, while Japan’s southern islands are within missile range. Taiwan increasingly focuses on asymmetric defense strategies.
Japan has unveiled evacuation plans for over 100,000 residents and tourists from its southern islands in a Taiwan crisis, with drills expected in 2026. These preparations are both practical and symbolic, signaling the real risk to Japan in any Taiwan contingency.
Taiwan’s Strategic Role: Deterrent or Flashpoint?
Taiwan’s growing visibility increases both deterrence and exposure. Explicit alignment with Japan and the U.S. enhances its strategic value, but also makes it more susceptible to surveillance, exercises, and gray-zone pressure. Taiwan is increasingly a focal point for signaling, where even minor incidents could escalate quickly.
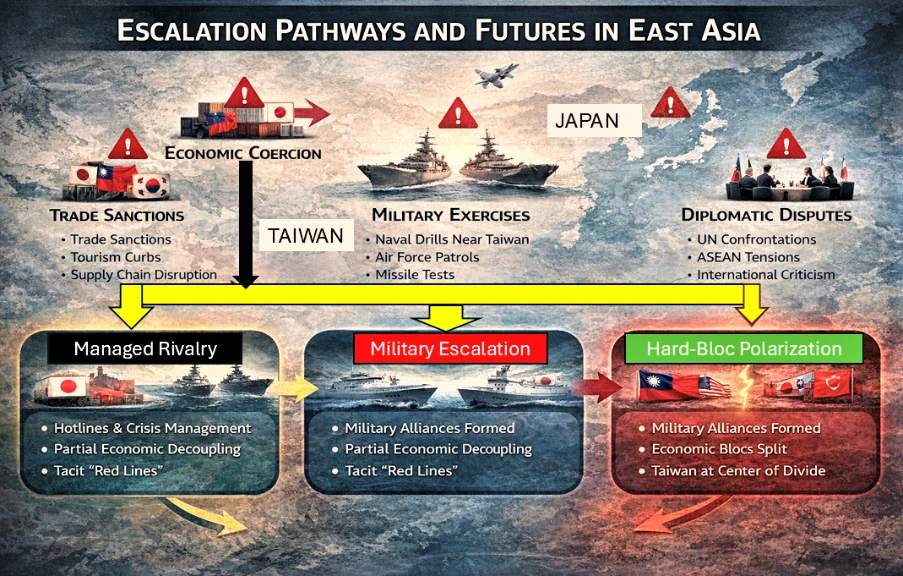
Escalation Pathways and Alternative Futures
Short-term full-scale conflict is unlikely, but incremental escalation is possible where there is:
Expanded Chinese economic strategy against Japan.
Military exercises near Taiwan and the Ryukyu Islands.
Diplomatic confrontations in multilateral forums.
Gray-zone incidents at sea or in airspace.
Potential long-term futures:
Managed Rivalry: Hotlines, forums, and tacit red lines reduce escalation; economic ties remain partially insulated.
Hard-Bloc Polarization: East Asia fractures into opposing security and economic blocs, with Taiwan as the central fault line.
East Asia 2025 escalation pathways showing economic coercion, military exercises, gray-zone incidents, diplomatic disputes, and outcomes: Managed Rivalry vs Hard-Bloc Polarization.
Policy Recommendations for Stability in East Asia
While tensions are rising, conflict is not inevitable. Practical steps to reduce risk include:
Crisis Hotlines: Permanent military-to-military communication channels between Japan and China can prevent misunderstandings near Taiwan and the Ryukyus.
Separate Economics from Security: Agreements via APEC or ASEAN+ to limit economic retaliation during security disputes reduce escalation incentives.
Careful Language: China, Japan and Asia partners while emphasizing maintaining of deterrence should leave space for diplomacy.
Without these measures, Taiwan risks becoming a trigger for broader conflict, and small misperceptions could escalate into crises.
FAQ: Key Questions About East Asia Security Dynamics
1: What is Japan’s current security stance on Taiwan?
Japan’s 2015 legislation allows collective self-defense if Taiwan contingencies threaten Japanese security, especially the southern islands. Recent statements reflect a shift toward clearer deterrence.
2: How has China responded to Japanese remarks on Taiwan?
China condemned Japan at the UN and used economic strategy in 2025, including suspending Japanese seafood imports and discouraging Chinese tourism.
3: Why is Taiwan becoming more exposed?
Closer alignment with Japan and the U.S. increases Taiwan’s deterrent value but also makes it more visible to Chinese surveillance, exercises, and gray-zone pressure.
4: What are the main risks of escalation in East Asia?
Risks include incremental economic coercion, military exercises near Taiwan, diplomatic disputes, gray-zone incidents, and potential blockades or accidental encounters.
5: What steps can reduce the risk of conflict?
Practical measures include crisis hotlines between militaries, insulating economic ties from security disputes, and careful, non-provocative deterrence language.
Australia has been experiencing a housing crisis. The housing crisis didn’t happen overnight. For decades Australia has not built enough homes to match growth in population and households. This persistent shortfall means more buyers and renters are chasing too few properties, pushing prices and rents higher. The crisis can be attributed to soaring demand, constrained supply, high construction costs and slow policy implementation.
The immediate impacts are record-low rental vacancy rates (<1% in many cities), over 30% of low-income households now in rental stress, and homeownership rates for young Australians collapsing. This erosion of secure housing directly undermines the stability that other social policies aim to create.
Australia's Strong Safety Nets vs Housing Market Failures
Australia offers one of the strongest social support systems in the developed world, making its housing crisis unusual.
Income security: Pensions, Jobseeker, Youth Allowance, family payments and income-tested transfers that reduce poverty and smooth income shocks.
Universal healthcare: Medicare and subsidized medicines ensure access to healthcare regardless of income.
Education and skills: Free public schooling, HECS-HELP for university, and subsidized TAFE and vocational training to support upward mobility.
Worker protections.
However, the housing market failure actively undermines these systems. Soaring rents can consume the majority of income support payments, nullifying their purpose of providing security.
Housing stress is a key driver of mental and physical health issues, placing greater strain on Medicare. The dream of upward mobility via education is compromised when graduates cannot afford to live near employment hubs, trapped in long commutes or unaffordable rentals.
The root causes of slow policy implementation are multifaceted, including a tax system favoring investors (negative gearing, CGT discounts), restrictive local zoning, political short-termism, and community resistance to density (NIMBYism), which collectively prevent a supply-side solution.
Australia's Housing Affordability Data: The numbers behind the crisis
A new report indicates that an average of 11.4 years is needed to save for the standard 20% deposit when buying a house in most Australian cities. In early 2002, it took less than seven years to save a 20% deposit.
Line Chart illustrating the rising number of years required to save for a 20% mortgage deposit in Australia, from 6.8 years in 2002 to a projected 11.4 years in 2026.Highlighting the growing challenge of housing affordability.
Key Insights from Line Chart: The rising number of years required to save for a 20% mortgage deposit in Australia
Australians needed less than 7 years of savings to put up 20% of the deposit in 2002.
It rose to 8+ years in 2010, a notable increase, reflecting the rising property prices and later on crossed the 9 year mark in 2015.
In 2020 it entered the double digit further emphasizing the affordability challenges and is projected to be at 11.4 years in 2026.
Data from OECD shows Australia's housing supply in 2022 was 420 per 1,000 people. The number of homes being offered for sale in Australia has fallen since 2015, and the number of homes for rent has been falling since early 2020 (ABC News).
The Cotality Housing Affordability Report (CoreLogic) notes Australian home values have risen by 47.3 per cent (nearly 50%) since the COVID-19 lockdown of 2020.
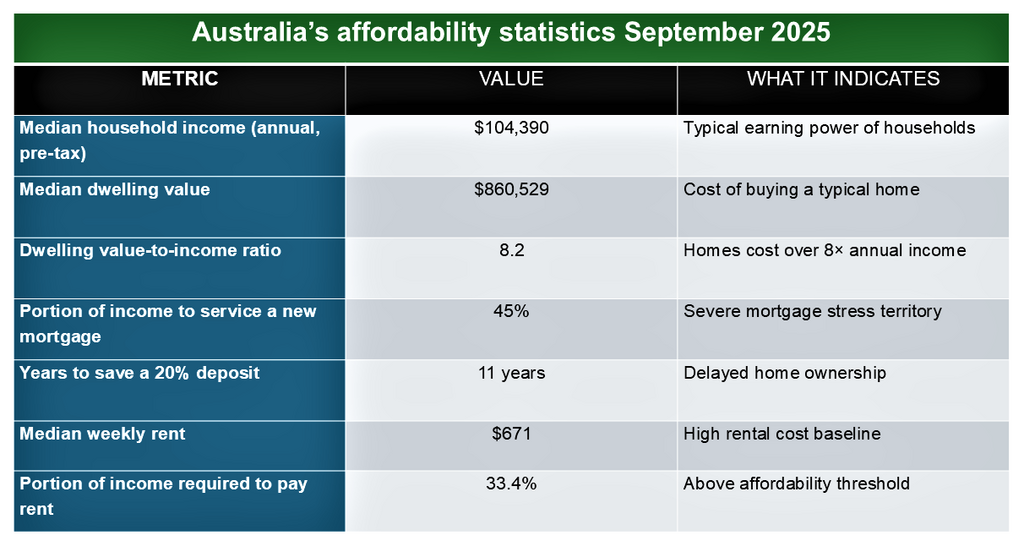
Table showing Australian housing affordability statistics September 2025: 8.2 price-to-income ratio, 45% mortgage burden, 33.4% rent burden, 11-year deposit timeline.
Key Insights from Chart: Australian housing affordability statistics September 2025
Australian housing affordability is under severe pressure.
A median dwelling price of $860,529 which is more than 8 times the median household income. Households now need 11 years to save a 20% deposit.
45% of income is required to service a new mortgage.
Bar chart analysis showing years required to save a standard 20% house deposit across Australia's capital cities in 2025.
Sydney remained Australia's most expensive city, with an average of 16.7 years needed to save for a 20 per cent house deposit.
The most affordable capital cities were Darwin, where only 6.8 years of saving was needed for a 20 per cent house deposit, and Canberra (9.5 years).
$26 Billion Plan vs Reality: Australia's Housing Policy Deliver Gap
The government has made nearly $26 billion in commitments to the housing problem. In the 2024-2025 budgets, it added another $6.2 billion in new commitments to the cause. Those measures will complement the well-publicized "target" to build 1.2 million new, well-located homes over five years, starting from 1 July 2024 to mid-2029.
What's been promised
The measures include:
1. An extra $1 billion to states and territories in support of the Housing Program to help them build infrastructure for new housing (sewage, road, water and power). 500 million had been previously committed.
2. $1.9 billion to increase the maximum rates of Commonwealth Rent Assistance by a further 10 per cent to alleviate rental stress.
3. $88.8 million for 20,000 new fee-free technical and further education (TAFE) in courses relevant to the construction sector.
4. An additional $1.9 billion in concessional loans to community housing providers and other charities to support delivery of new social and affordable homes under the Housing Australia Future Fund and National Housing Accord.
5. Allow foreign investors to purchase established build to rent developments with a lower foreign investment fee.
6. $423m in additional funding to the National Agreement on Social Housing and Homelessness to boost support for social housing and homelessness services (National Housing Homelessness Plan).
Pie chart illustrating government funding allocation: Infrastructure $1.5B, Rent Assistance $1.9B, Social Housing $1.9B, Skills Training $0.09B, and Homelessness $0.42B.Highlights the relative proportions of spending priorities.
Key Insights from Pie Chart: Government funding allocation
Rent Assistance & Social Housing dominate the allocation at $1.9B each, reflecting strong investment in housing affordability.
Infrastructure receives $1.5B, a significant share aimed at long-term development.
Homelessness support is allocated $0.42B, showing targeted but smaller-scale funding.
Skills Training receives the least at $0.09B, suggesting limited emphasis compared to housing and infrastructure.
What has been delivered:
Government Progress to Date:
Supply in Motion: Pipeline data confirms tens of thousands of homes are under construction or completed, though the current pace remains below the 1.2-million-home target.
Immediate Rent Relief: Increased Commonwealth Rent Assistance payments are active, providing direct support to eligible households.
Long-Term Capacity Building: Fee-free TAFE and construction pre-apprenticeships (2024–25) are underway to address chronic skilled labour shortages, a multi-year solution.
Social Housing Pipeline: Contracts for approximately 18,650 new social and affordable homes have been finalized, backed by over $1.2 billion in approved federal loans and grants.
Australia government housing plan 2026 table showing rent assistance, infrastructure funding, social housing projects, construction skills, build‑to‑rent incentives, and 1.2 million homes target with progress updates.
The Australian government needed to facilitate the construction of 60,000 new homes per quarter to meet this target. After a year of underperformance, the target for the remaining four years is now 63,810 new homes per quarter (economic research and forecasting, HIA).
Six Critical Barriers: Why Australia can't build enough homes
1. Build capacity is too low: The 1.2 million target requires an estimated 240,000 homes per year, which is above Australia’s sustained historical construction capacity.
2. Severe labour shortages: A lack of skilled trades (builders, electricians, plumbers) limits how many homes can be built and training new workers takes years.
3. High construction and financing costs: Rising material prices, builder insolvencies, and higher interest rates have made many approved projects financially unviable.
4. Planning and zoning delays: Local planning restrictions and slow rezoning processes continue to block higher-density housing where demand is highest.
5. High interest rates slowed private building: Most homes are built by the private sector, which reduced activity due to higher borrowing costs.
6. The target is non-binding: States face no penalties for missing benchmarks, leading to uneven delivery and weak enforcement.
A chart showing why Australia failed to meet its target of affordable housing.
Key Insights from Bottleneck Analysis: Why targets were missed
The targets were missed because of labour Shortages which contributed to 40% of the cumulative failure highlighting workforce availability issues.
High Costs (35%) represent the second largest challenge, reflecting financial constraints.
Planning delays (25%) contribute a quarter of missed targets, showing the impact of inefficiencies in project management.
Global Comparisons: UK, Canada and the Limits of Policy
United Kingdom (UK)
In the UK, the housing crisis is driven by long-term underbuilding, particularly in London and the South East, combined with restrictive greenbelt policies that limit new development.
High demand from a growing population and international investors has pushed house prices far beyond average incomes, leaving many first-time buyers struggling to enter the market. The UK government has taken initiative by:
Global housing affordability comparison chart showing price-to-income ratios for top 10 unaffordable cities. Hong Kong most unaffordable at 16.7, Australian cities Sydney and Melbourne rank in top 5.
3.0 (Affordable)
5.1 (Severely Unaffordable Threshold
8.3 (Toronto baseline)
Key insights: Global housing affordability comparison
Hong Kong is in a League of Its Own: With a ratio near 17, it is consistently the world's most unaffordable market. Housing costs are attributed to by extreme land scarcity, investment demand, and geographic constraints.
Dominance of "New World" Anglosphere Cities: Australian, Canadian, New Zealand and U.S. cities dominate the list. This reflects a shared set of challenges: restrictive zoning housing as a financialized investment asset, and supply systems that fail to respond elastically to demand.
The Canadian duo,Vancouver (3rd) and Toronto (10th) highlight a parallel crisis to Australia's, driven by high immigration and supply constraints
The U.S. Tech Hub:San Jose (4th), Los Angeles (7th), and San Francisco (8th)represent the high-cost U.S. coastal model, where high wages meet extremely restrictive land-use policies thus crippling supply.
Canada
Meanwhile, Canada faces a similar challenge, especially in urban centers like Toronto and Vancouver, where limited housing supply, restrictive zoning and strong demand from immigration and investors have caused prices and rents to soar. The initiatives are:
National Housing Strategy with federal investment.
Build Canada Homes agency (an estimated $13 billion).
Intergovernmental coordination for approvals & financing.
Policy innovations: public land, GST relief, modern construction technology.
Canada has the largest coordinated federal effort, using a dedicated agency and multi-billion-dollar funding. Australia combines supply targets with social housing and rent assistance, but targets are ambitious and behind schedule. Meanwhile, the UK focuses on tenant protection and targeted subsidies but struggles with supply in high-demand areas. What Australia can learn from Japan's Housing Success
Japan-it has kept housing relatively affordable for decades, even in Tokyo, one of the world’s largest cities and it does this without massive subsidies or rent controls.
What Japan does right
By-right zoning: If land is zoned residential, building approval is fast and predictable.
High-density acceptance: Apartments, mixed-use, and infill housing are normal, not controversial.
Continuous building: Japan builds a lot of homes every year, even as population growth slows.
Housing treated as infrastructure, not an investment vehicle
Global Implications: Housing as Economic Risk in Advanced Economies
1. A warning for other advanced economies. Australia shows that even wealthy, stable countries can reach crisis-level unaffordability if housing supply cannot respond quickly to demand. This is highly relevant for countries like Canada, the UK, Ireland, and parts of the EU facing similar pressures.
2. Housing as a global inflation and inequality driver. When housing absorbs 30–45% of household income, it limits consumer spending elsewhere, worsens wealth inequality between owners and renters and pushes younger generations into long-term precarity
Globally, this reinforces the idea that housing is now a central economic risk, not just a social issue.
3. Constraints on labour mobility. High housing costs reduce workers’ ability to move to where jobs are which lowers productivity, worsens skill shortages and makes cities less competitive.
4. A case study in policy limits. Australia demonstrates that funding alone is insufficient without planning reform and non-binding targets don’t deliver supply. This emphasizes the importance of great policy implementation.
The Way Forward: Policy, Markets, and Citizens
Australia’s housing crisis cannot be solved by funding alone. The path forward requires structural reform, sustained supply, and shared responsibility across government, markets, and society.
Fix supply at scale. Housing targets should be binding, coordinated nationally and backed by infrastructure delivery.
Treat housing as essential infrastructure. Social and affordable housing should be built continuously, at scale, and not for political cycles
Rebuild construction capacity. Skilled migration, apprenticeships and modern building methods must expand the industry’s ability to deliver homes efficiently and at lower cost.
Rebalance housing as a home, not just an asset. Tax, investment, and regulatory settings should prioritize long-term rental stability and livability over speculative price growth.
Align population growth with housing delivery. Migration, labour needs, and urban planning must move together to prevent future shortages.
For Investors Briefing
Short term:
Focus on essential rentals in resilient middle‑ring suburbs near hospitals, schools and transport.
Support build-to-rent models by partnering with government and institutions to increase housing supply.
Medium term:
Invest in construction enablers:prefabrication, materials innovation, and proptech.
Invest outside overheated markets: Look beyond major capitals where affordability and demand fundamentals are more balanced; Perth, Adelaide, Brisbane or key regional hubs.
Long term:
Shift metrics from speculation to stability, efficiency and social impact.
Diversify into alternative real assets (healthcare, logistics) to reduce exposure to housing policy volatility.
Anchor strategy on long-term rental income rather than short-term capital gains.
Key Takeaways: Australia's Housing Crisis
1. Australia’s housing crisis is structural; it is driven by long-term undersupply rather than short-term shocks.
2. Housing costs now consume 30–45% of household income, undermining living standards despite a strong welfare system. Government funding and targets exist, but delivery is constrained by labour shortages, planning delays, and high construction costs.
3. The 1.2 million homes target is ambitious but currently behind pace, highlighting capacity limits.
4. International comparisons show Australia’s challenge is shared globally, but countries that prioritize fast, flexible supply perform better.
5. Lasting affordability will require planning reform, sustained construction capacity, and housing treated as essential infrastructure.
FAQs: Australia's Housing Crisis Analysis
1. What is the main cause of Australia's housing crisis?
The crisis is primarily caused by a structural and decades-long shortfall in housing supply failing to keep pace with population and household growth. This fundamental imbalance is exacerbated by high construction costs, soaring demand, and slow policy implementation.
2. How can Australia have a strong social safety net but a housing crisis?
Australia's robust social supports (like Medicare and income security) exist alongside the housing crisis, which highlights a specific market and policy failure. The crisis actively undermines these other systems, as high housing costs consume welfare payments and negatively impact health and mobility.
3. What are the immediate impacts of the housing crisis in Australia?
The most immediate impacts are severe rental stress (with over 30% of low-income renters affected), record-low vacancy rates, and a collapse in homeownership rates among younger generations, eroding long-term economic security.
4. Why has Australian policy failed to fix the housing crisis?
Policy implementation has been slow due to a combination of factors: tax incentives favoring investors (e.g., negative gearing), restrictive local zoning laws, political short-termism, and community resistance to increased density (NIMBYism).
5. What is the link between housing and social mobility in Australia?
The analysis finds that the housing crisis directly compromises social mobility. Even with strong education supports like HECS-HELP, high housing costs and unaffordable locations near jobs trap individuals, limiting the upward mobility other social policies aim to create.
Foreign Direct Investment (FDI) has long been a cornerstone of Europe’s economic growth, job creation, and technological progress. FDI typically involves long-term strategic commitments, such as acquiring at least 10% of voting shares in a foreign enterprise. It's important to note that the cited EY survey data measures FDI projects, which include new physical operations like manufacturing plants and R&D centers, capturing the broader trend of investment commitments.
Key Takeaway: Europe’s decline in foreign direct investment is not cyclical, it reflects a structural loss of competitiveness driven by geopolitical risk, regulatory complexity, and stronger industrial incentives in rival economies.
Yet Europe’s investment climate has shifted sharply. According to the EY Europe Attractiveness Survey (2025), Europe recorded its lowest number of FDI projects in nine years during the 2024–2025 period. This decline signals a structural change in global investment patterns and raises urgent questions about Europe’s competitiveness.
FDI projects in Europe 2015 to 2025 line graph showing record peak in 2017, post‑pandemic surge, and projected structural decline to 2024 low.
While part of the downturn reflects a broader global slowdown in capital expenditure following the post-pandemic surge, the scale and persistence of Europe’s decline suggest deeper issues tied to geopolitics, regulation, and industrial strategy. This trend is particularly acute for Europe, as investment flows are increasingly re-concentrating in North America and East Asia.
Causes of Europe’s FDI Decline: Geopolitics, Regulation, and Energy Costs
Geopolitical instability has become a major deterrent for foreign investors. The ongoing Russia–Ukraine war has elevated risk perceptions across the continent, particularly in Central and Eastern Europe. Trade uncertainty and political risk have weakened investor confidence throughout the region.
Regulatory complexity has constrained Europe’s appeal. In February 2025, EU officials acknowledged that excessive administrative and sustainability-related requirements were limiting competitiveness, prompting renewed discussions on regulatory reform.
While environmental standards are a core European value, slow permitting processes, fragmented national rules, and overlapping reporting obligations raise project costs and extend timelines, critical factors for multinational investors deciding where to locate new facilities.
High energy prices compound these challenges. Compared to the United States and parts of Asia, European manufacturers face structurally higher electricity and gas costs, reducing margins and long-term predictability. For example, industrial electricity prices in key economies like Germany have remained multiples of those in the U.S., driven by geopolitical supply shifts and network costs.
Structural Competitiveness and Manufacturing Shifts
Europe’s FDI decline reflects deeper structural competitiveness issues. Relative to the United States and China, Europe struggles with:
Slower industrial scaling.
Fragmented industrial policy across member states.
Smaller, less integrated capital markets.
EY reports a sharp fall in manufacturing investment in 2024, as capital increasingly flows toward the U.S. and China. The U.S. Inflation Reduction Act and CHIPS Act provide large, clear fiscal incentives, while China offers scale, speed, and tightly integrated supply chains. These environments reduce uncertainty and accelerate returns as decisive advantages for global firms.
Europe’s policy response, by contrast, remains uneven. National subsidy regimes differ widely, and cross-border projects still face legal and bureaucratic friction within the single market.
FDI inflows comparison chart Europe United States China 2020 to 2025 showing investment trends and projections.
Key Insightsfrom the Actual FDI Inflows: Europe vs. United States vs. China (2020–2025) Europe
Highly volatile flows: from $151B in 2021 to –$106B in 2022 (a net outflow).
Weak recovery: only $16B in 2023, then estimated $182B in 2024 and projected $170B in 2025.
This volatility reflects financial conduit flows (e.g., Luxembourg), making Europe less stable for FDI.
United States
Consistently strong inflows: peaked at $388B in 2021, then stabilized around $285–343B.
Projected to remain the global leader with $330B in 2025, showing resilience and investor confidence.
China
Moderate but steady inflows: $144B in 2020 → $189B in 2022, then declining to $115B (2024 est.) and$108B (2025 proj.).
Reflects reduced green financial FDI and policy-driven shifts, though still significant in scale.
Strategic Implications
Investor Confidence: The U.S. remains the most attractive destination due to policy stability and strong market fundamentals, reinforcing its role as the global FDI hub.
Europe’s Challenge: Persistent volatility undermines investor trust, signaling the need for structural reforms, reduced reliance on financial conduit flows, and stronger strategic autonomy.
China’s Shift: Declining inflows highlight the impact of geopolitical tensions and reduced green finance, pushing China to diversify supply chains and recalibrate its investment model.
Global Capital Reallocation: Investors are increasingly de‑risking by redirecting funds toward stable, policy‑backed markets (U.S.) and emerging hubs in Asia, reshaping the global investment landscape.
Takeaway: FDI flows are realigning toward stability and strategic industries, leaving Europe at risk of marginalization unless it adapts.
Regional Fragmentation of FDI in Europe
The downturn in foreign investment in Europe is not uniform. Central, Eastern, and Southeastern Europe have suffered the steepest declines. According to data cited by EY, total inflows to these regions fell by roughly 25% in 2024. Poland alone experienced a 48% drop.
These disparities reflect:
Higher exposure to geopolitical risk.
Weaker infrastructure in some regions.
Lower fiscal capacity to match U.S.-style incentives.
The result is a widening investment gap between Europe’s core economies and its periphery, threatening long-term convergence within the EU.
Sectoral Shifts and the Decline of U.S. Investment
A notable feature of recent FDI trends in Europe is the contraction of U.S.-sourced investment. EY reports that jobs created through U.S. investment in Europe have almost halved in recent years, indicating a strategic reorientation toward domestic U.S. production.
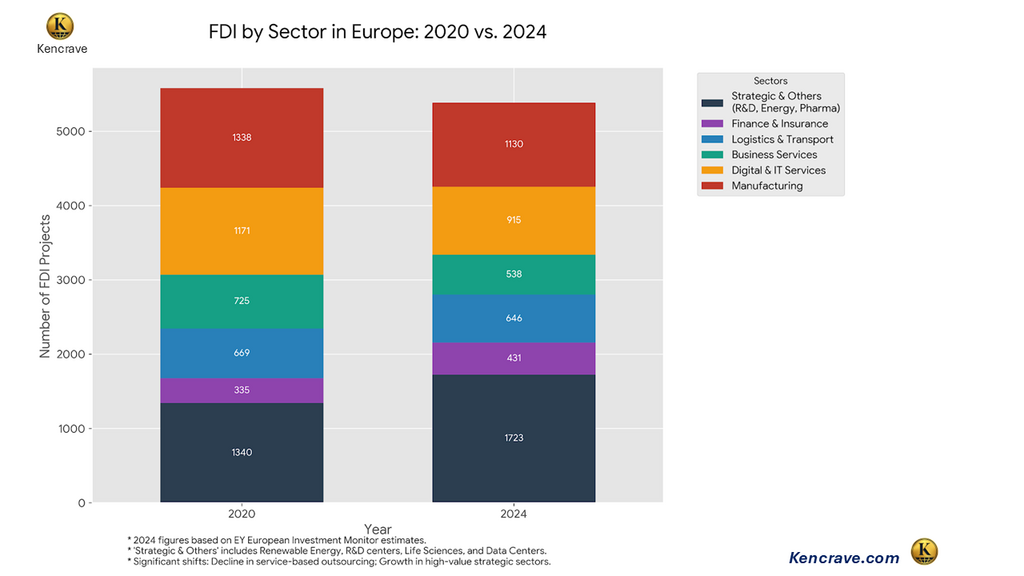
FDI by sector in Europe 2020 vs 2024 bar chart showing investment trends across manufacturing, digital services, finance, logistics, and strategic industries.
Europe remains competitive in logistics and segments of the electric vehicle supply chain. However, high-growth sectors like advanced semiconductors, artificial intelligence, and green energy manufacturing, are increasingly gravitating toward North America and East Asia, where incentives are larger and deployment is faster.
What Europe Can Do: Policy Levers to Restore Investment Appeal
To reverse these trends, Europe must move from diagnosis to action. Key reforms could include:
Regulatory simplification: Streamlining permitting, harmonizing standards across member states, and reducing overlapping reporting requirements.
Targeted fiscal incentives: Coordinated EU-level tax credits and subsidies for strategic sectors such as semiconductors, batteries, AI, and clean energy.
Energy cost stabilization: Long-term power pricing mechanisms for industrial users and accelerated grid investment.
Single-market deepening: Faster cross-border project approvals and unified capital markets to support large-scale investments.
These measures would not replicate U.S. or Chinese models but could restore predictability and scale, two qualities investors value most.
Capital reallocation in strategic assets chart showing Europe’s shift 2020 to 2024 with global investment flows to USA, South East Asia, and China driven by industrial policy and geopolitical realignment.
Long-Term Implications for European Competitiveness
Persistently lower FDI threatens Europe’s position in critical future industries. Reduced investment in AI, renewable energy, and advanced manufacturing may:
Slow productivity growth.
Weaken innovation ecosystems.
Limit high-skilled job creation.
Over time, this could widen the economic gap between Europe, the United States, and Asia.
Bottom Line
Nonetheless, the EY Europe Attractiveness Survey notes cautious optimism. If regulatory reform and industrial coordination materialize, Europe can still leverage its strengths: political stability, skilled labor, and a large consumer market. This optimism is partly underpinned by nascent EU initiatives like the Net-Zero Industry Act and ongoing efforts to advance the Capital Markets Union, which aim to directly address some identified barriers.
Key Takeaways: Foreign Direct Investment in Europe
Europe’s FDI decline reflects structural weaknesses, not just a temporary global slowdown.
Geopolitical risk and regulatory complexity have become decisive deterrents for investors.
The U.S. and China are attracting capital through scale, speed, and aggressive industrial policy.
Central and Eastern Europe are disproportionately affected, widening intra-EU divergence.
Recovery depends on regulatory simplification, energy cost stabilization, and coordinated EU-level industrial strategy.
FAQ: Foreign Direct Investment in Europe
1.Why is FDI falling in Europe in 2025? FDI is declining due to geopolitical risk, regulatory complexity, high energy costs, and stronger incentives in the U.S. and China.
2. Which European countries are most affected? Central and Eastern European states have seen the largest drops, with Poland experiencing nearly a 50% decline in inflows.
3. Is Europe losing competitiveness? Relative to the U.S. and China, Europe is struggling to offer the same scale, speed, and certainty for investors in strategic sectors.
4.Can FDI in Europe recover? Yes, but recovery depends on regulatory simplification, coordinated industrial policy, and energy market reform.
A leading global company for Business Solutions , bringing the intriguing global business arena into your space to a business and financial savvy mind.
social media:
Stay In Touch
Don't hesitate. Reach us with these info.
0795046415financialshub01@gmail.comNairobi/Kenya
We create great content everyday. Subscribe to be the first notified when released.
%20(1).png)
%201%20(1).png)

%20(1).png)


.png)


.png)
.png)
.png)