Australia financial markets outlook 2026 visual, featuring Sydney skyline, RBA policy themes, liquidity strategy, and global investment trends. Image Credits: Kencrave
Australia Financial Markets Outlook 2026: Late Cycle Expansion, Rba Policy, And Investment Strategy
Executive Summary: Australia Financial Markets Outlook 2026
Australia’s financial markets in 2026 are operating in a late-cycle expansion, characterised by moderate growth, persistent inflation, and a cautious Reserve Bank of Australia (RBA) policy stance. While the Australian economy has shown resilience relative to global peers, restrictive financial conditions, elevated household debt, and tightening domestic liquidity are limiting acceleration.
This report provides an Australia financial markets outlook for 2026, examining business cycle positioning, GDP growth forecasts, labour market dynamics, RBA monetary policy, fiscal policy settings, liquidity conditions, geopolitical risks, and sector-level investment strategy.
Summary table of Australia’s 2026 macroeconomic indicators including cash rate, inflation, GDP growth, and unemployment trends with strategic impacts. Source: RBA/ABS.
Australia Business Cycle Analysis: Late-Cycle Economic Resilience
Late-Cycle Expansion: A late-cycle expansion occurs when economic growth remains positive but slows toward trend. Inflation pressures persist, labor markets stay firm, and monetary policy becomes restrictive. Asset prices become more sensitive to shocks as policy support fades.
Australia has avoided the “per capita recession” traps of 2024–2025 and has transitioned into a broad-based recovery. Growth, however, remains modest rather than explosive. The economy has clearly moved past early-cycle acceleration and into a mature expansion phase.
Current Business Cycle Phase: Late-Stage Expansion
Key Economic Indicators for Australia Outlook 2026
1. GDP Growth Outlook
Projected real GDP growth of approximately 2.1% in 2026 by IMF reflects moderate, trend-aligned expansion rather than overheating (Commbank, 2026). Independent data corroborate this outlook, pointing to steady but restrained growth consistent with long-run potential.
The composition of growth is evolving. Momentum is increasingly investment-led, driven by private capital inflows into:
Data centres.
Renewable energy.
Digital infrastructure.
This shift signals improving capital deepening, productivity potential, and structural resilience within the economy. While headline growth remains modest, its quality has improved. The expansion is increasingly anchored in long-term asset formation, technological capacity, and energy transition dynamics rather than cyclical excess or demand-side overheating.
2. Labour Market Conditions in Australia
Unemployment remains low and stable at around 4.1%as of January 2026, signalling a labour market that is broadly tight and not exhibiting clear signs of overheating. At the same time, underutilisation has risen (Australian Bureau of Statistics, 2026).
This points to emerging hidden labour slack. Spare capacity persists through reduced hours, involuntary part-time employment, and weaker labour demand in certain sectors. Labour market conditions are therefore less uniformly tight than headline unemployment suggests.
This allows continued employment absorption without immediate inflationary pressure, even as headline indicators remain resilient.
3. PMI Trends and Manufacturing Activity
The Manufacturing Purchasing Managers’ Index (PMI) registered 51.6 in January 2026, indicating modest expansion in manufacturing activity. Growth is supported by an increase in new orders.
However, overall momentum remains muted. Elevated input costs and a slow export environment continue to weigh on profitability and production confidence. The data suggest cautious expansion rather than robust acceleration.
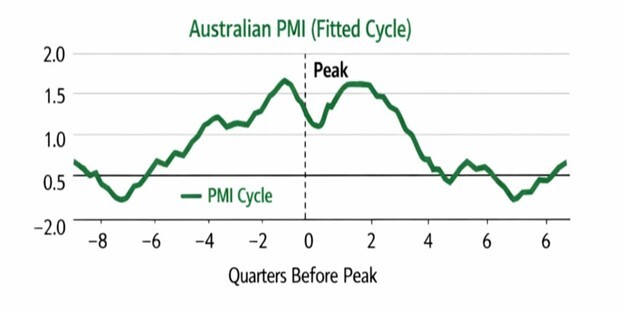
PMI (Purchasing Managers’ Index): A diffusion index measuring manufacturing and services activity. Readings above 50 (0.5) indicate expansion, while readings below 50 signal contraction.
In a mid-to-late expansion phase, PMI readings typically remain above 50 (0.5) but trend downward toward the neutral line. This signals slowing momentum as the economic cycle matures.
Australian PMI fitted cycle chart showing business activity trends before and after peak, highlighting economic growth and contraction phases.
4. Leading Economic Indicators (LEI)
Leading indicators point to continued but moderate economic momentum heading into 2026. The Conference Board’s Leading Economic Index (LEI) for Australia recorded a modest increase in November 2025.
This suggests the economy is still expanding and retaining forward growth traction rather than rolling over into contraction. However, the improvement lacks the strength typically associated with late-cycle acceleration.
Similarly, the Westpac–Melbourne Institute Leading Index continues to print positive yet subdued readings. Together, these indicators imply an economy operating close to its trend path. Growth momentum is intact, downside risks appear contained, and conditions do not point to either imminent slowdown or overheating.
Australia’s Mature Expansion Phase: Growth Without Acceleration
Australia has transitioned into a mature expansionary phase, moving past the high-velocity growth typical of early recovery. Economic activity remains positive, supported by expanding manufacturing output and steady leading indicators.
The pace of growth, however, has plateaued. Businesses continue to invest and labour markets remain firm, but fresh acceleration is absent. This confirms a mid-to-late cycle environment.
In this stage, momentum is sustained but increasingly susceptible to headwinds. Rising costs, softening global demand, and monetary tightening pose growing risks. While the expansion may persist, its resilience to external shocks is gradually diminishing.
Monetary and Fiscal Policy Outlook: RBA Strategy and Government Support
Reserve Bank of Australia Monetary Policy
The Reserve Bank of Australia eased the cash rate several times throughout 2025, gradually moving away from previously restrictive settings. Despite these cuts, monetary conditions are now approaching neutral rather than stimulative.
Lending costs have fallen and credit is more accessible. Household debt, however, remains elevated, limiting consumer spending and constraining overall demand. Compared with other major central banks, the RBA has taken a cautious approach. While G10 peers pursued aggressive rate reductions, the RBA maintained a measured “wait and see” bias.
As of January 2026, the cash rate stood at3.60% and 3.80%as of February 2026 moving away from the RBA’s target band of 2–3% target (Reserve Bank of Australia, 2026).
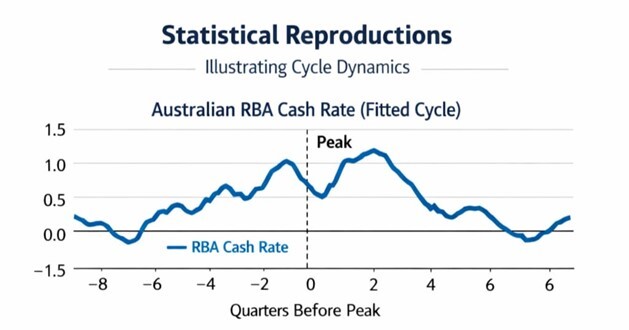
Neutral Interest Rate: The interest rate level that neither stimulates nor restricts economic growth when inflation is stable.
The Risk: Inflation is no longer driven by global supply chains but by domestic demand for services and high housing costs, making it harder to "break" with interest rates alone.
The cash rate chart illustrates the typical monetary policy path during an expansion. Interest rates generally rise as the economy nears its peak to curb inflation. However, the peak in the cash rate often occurs after the economic peak, as the RBA maintains restrictive settings to ensure price stability.
Fiscal Policy: Targeted Government Support
Australia’s fiscal policy in 2025 reflected a balance between supporting growth and maintaining sustainable public finances. According to the Mid-Year Economic and Fiscal Outlook (MYEFO), policy shifted away from broad demand stimulus.
Support is now targeted toward private-sector capacity building. This includes subsidies for “Future Made in Australia” green energy initiatives. The budget moved from surplus to a modest deficit, providing an expansionary impulse without excessive pressure on public debt.
Taxation and spending adjustments aim to support consumption and encourage investment. The approach remains measured, prioritising growth while preserving fiscal discipline.
Domestic and Global Liquidity Conditions
Liquidity: Liquidity refers to the availability of credit and money within the financial system to support spending, investment, and asset prices.
Domestic Liquidity in Australia
Liquidity conditions for households and small businesses are gradually tightening. Elevated debt, higher borrowing costs, and cautious lending standards are weighing on discretionary spending and small-scale investment.
Credit remains available, but not loose by historical standards. Following RBA easing, borrowing costs have moderated and business debt is expanding slowly. Elevated debt burdens continue to limit spending capacity.
Takeaway: Liquidity is sufficient to sustain activity but does not provide a strong growth impulse.
Global Liquidity Backdrop
Global credit markets show early signs of cyclical recovery. As major central banks pause or cut rates, a liquidity floor has formed, preventing a systemic credit crunch.
Despite this, investor confidence remains fragile. Markets face a “wall of worry” driven by inflation volatility, geopolitical tensions, and shifting fiscal regimes. As a result, risk assets continue to experience sharp volatility even with adequate liquidity.
This suggests central banks can stabilize financial flow but cannot suppress price swings caused by macro uncertainty.
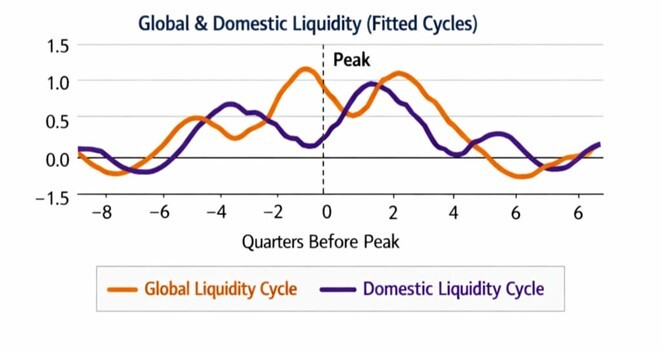
Comparative chart of global liquidity cycle and domestic liquidity cycle, showing synchronized peaks and cyclical market liquidity trends across quarters.
Key Insights: Global & Domestic Liquidity (Fitted Cycles)
Australia’s current economic position aligns with the critical juncture in the chart where global liquidity (orange) has peaked and begun to subside, while domestic liquidity (purple) remains temporarily elevated.
The ''lag'' explains why the domestic economy still exhibits firm employment and business activity even as the broader global support system thins out.
Australia is currently sitting in a vulnerability window between two major cycles. Domestic conditions are still supporting growth, but with global liquidity retreating, the expansion has lost momentum and become highly sensitive to external shocks such as shifts in international demand or rising global costs.
As a result, the economy is now on a fragile plateau, growth can continue, but without a global tailwind, Australia is increasingly exposed to being dragged down by higher costs or weakening global demand.
Geopolitical Risk and Trade Fragmentation
Geopolitical Risk: Economic risk arising from international conflict, trade policy shifts, sanctions, cyber threats, and strategic competition between states.
Australia balances a commodity super-cycle against growing trade fragmentation risks. The green energy transition boosts demand for critical minerals, supporting fiscal revenues. At the same time, rising protectionism and friend-shoring create volatile market access.
Sustained prosperity now depends as much on diplomatic agility as on resource abundance.
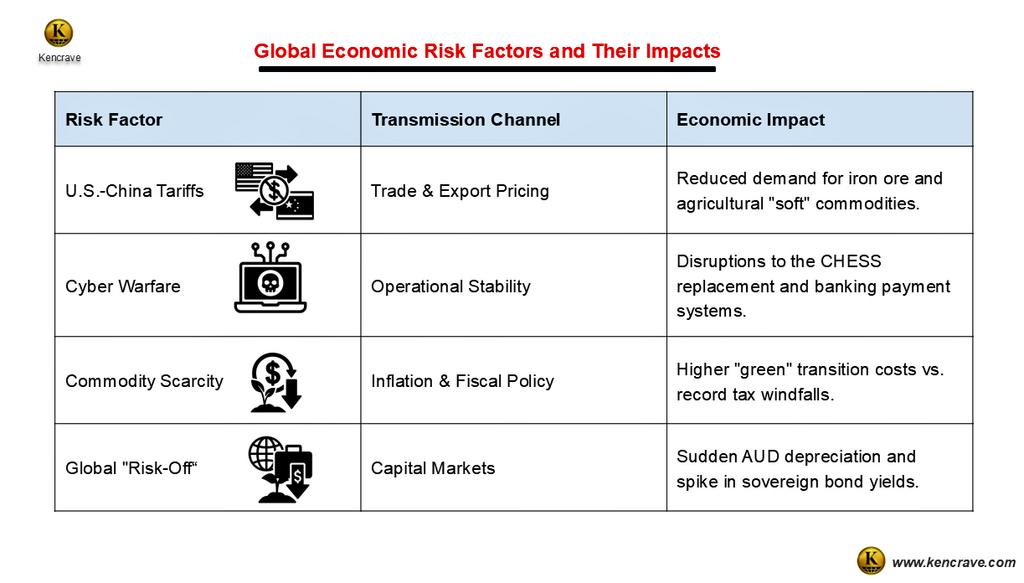
Macro Risk Transmission Channels
Geopolitical risks increasingly operate through policy rather than price. Global supply chains are being reshaped by national security priorities, replacing efficiency with resilience.
Domestic financial stability is also exposed to cyber threats targeting national infrastructure. Regulators warn that non-financial risks can rapidly trigger systemic shocks. With global risk premia unusually low, markets are vulnerable to disorderly reassessments.
Australia’s open economy status makes it a high-beta exposure to global stability. Escalations in trade or military conflict could rapidly transmit volatility through currency depreciation and higher borrowing costs.
Table of global economic risk factors with transmission channels and impacts, including tariffs, cyber warfare, commodity scarcity, and capital market volatility.
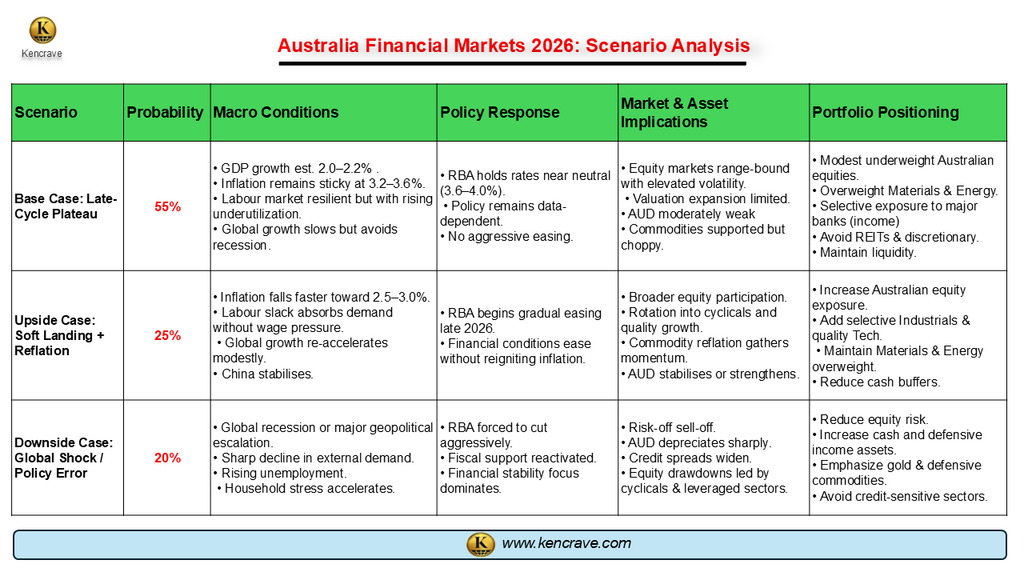
Scenario Analysis: Australia Financial Markets 2026
With inflation, growth, and policy outcomes still uncertain, a scenario-based approach helps frame the range of possible paths for Australia’s economy in 2026. The scenarios below outline a base case and key upside and downside risks, and show how different outcomes could affect markets, policy decisions, and investment positioning.
The base case reflects the most likely continuation of current late-cycle dynamics, while the upside and downside scenarios capture asymmetric risks that could materially alter market outcomes and investment strategy.
What Would Invalidate the Base Case
The base case would be invalidated by a clear shift in inflation, growth, or financial stability dynamics. A faster-than-expected decline in services inflation, driven by rising labour slack, would allow earlier RBA easing and shift the outlook to the upside.
Conversely, a sharp global growth shock or accelerating household credit stress would overwhelm domestic resilience and push the economy into the downside scenario. Any of these outcomes would signal a regime change and require a reassessment of policy expectations and portfolio positioning.
Scenario analysis chart of Australia’s 2026 financial markets showing base case, upside soft landing, and downside global shock with probabilities, policy responses, and portfolio strategies.
ASX Sector Sensitivity: The 4.25% Terminal Rate Stress Test
With inflation trending above the target range, markets are now pricing in a potential terminal rate of 4.25% (Money Management, 2026). This environment creates a sharp divergence in sector performance:
High-Risk Sectors (Underweight)
A-REITs: Property trusts are highly sensitive to the cost of capital. Higher rates lead to capitalisation rate adjustments, pressuring valuations (Pitcher Partners, 2026).
Technology & Growth: Valuation multiples for ASX tech (e.g., Wisetech, Xero) are compressing as higher discount rates reduce the present value of future earnings.
Consumer Discretionary: Households facing a "higher-for-longer" mortgage environment are expected to significantly pull back on non-essential durable goods (Discovery Alert, 2026).
Resilient Sectors (Overweight/Defensive)
Banks: Major financial institutions may see expanded Net Interest Margins (NIM) as they reprice loans faster than deposits, though credit risk must be monitored (Motley Fool, 2026).
Materials & Resources: Gold and base metal miners often act as an inflation hedge, benefiting from operational leverage and a potentially weaker AUD (Discovery Alert, 2026).
ASX sector strategic risk matrix chart mapping risk level vs. return potential for 2026, highlighting Materials, Energy, Tech, Financials, Healthcare, and REITs.
Key Insights: ASX Sector Strategic Risk Matrix 2026
Materials & Energy: Remain the "sweet spot" with high return potential driven by the global energy transition, despite moderate cyclical risks.
A-REITs & Consumer Discretionary: Categorized as "High Risk/Low Return" as the cost of debt and falling household disposable income act as severe headwinds.
Financials (Banks): Offer defensive stability with moderate return potential as margins expand, though they face rising credit risk.
Strategic Implications and Positioning for Investors, policymakers, corporates and Risk Managers
For Investors (Asset Managers, Fund Managers) Sector Positioning
Overweight:Materials & Energy (energy transition demand, commodity leverage, AUD hedge); Selective Major Banks as defensive income holdings, with close monitoring of credit quality.
Selective / Satellite Exposure:Profitable Technology and Data Infrastructure; Critical Minerals with strong balance sheets and secure offtake agreements.
Underweight / Avoid:A-REITs, Consumer Discretionary, and highly leveraged industrials due to funding-cost pressure and household balance-sheet stress.
Portfolio Construction
Prioritise quality, cash flow, and dividends over valuation expansion.
Maintain liquidity and flexibility to exploit volatility.
Use commodities as a portfolio hedge, not a high-conviction directional trade.
Key Watchpoints
Services inflation and labour-market slack.
RBA policy signalling.
Evidence of household or SME credit stress.
For Government & Policymakers (RBA, Treasury)
Stay the Course, but Be Nimble: Maintain a data-dependent monetary policy. Do not cut rates prematurely while services inflation is "sticky," but acknowledge that overly restrictive settings could trigger a downturn.
Double Down on "Future Made in Australia": Use targeted fiscal policy (tax incentives, R&D credits) to accelerate private investment in the identified growth pillars: renewable energy, critical minerals processing, and digital infrastructure.
Invest in National Resilience: Significantly boost funding and regulation for cybersecurity in financial infrastructure (e.g., payment systems) to mitigate a major operational risk highlighted in the report.
Monitor Household Debt & SME Liquidity: While tightening is needed, be alert to the point where high household debt and tighter credit for small businesses severely dampen demand. Prepare contingency support measures.
For Corporates (CFOs, Strategy Teams)
Lock in Financing Now: If you need capital, secure loans or refinance debt soon. Domestic liquidity is contracting and borrowing costs, while off peaks, may not get significantly cheaper in the short term.
Invest for Productivity: Align capital expenditure (CapEx) with structural trends. Prioritize investments in technology automation, energy efficiency, and supply chain resilience to offset high input costs and a tight labor market.
Stress-Test Your Supply Chain: Map organization's exposure to U.S.-China tensions and geopolitical shocks. Diversify suppliers and logistics routes to avoid being caught in trade fragmentation.
Target Growth Sectors: If considering expansion or M&A, focus on the "selective risk-on" sectors: services tied to the digital economy, energy transition, and infrastructure build-out.
Manage Costs Rigorously: In a late-cycle environment with modest growth, protect your margins. Scrutinize operational expenses and prepare for potential volatility in commodity input prices.
For Risk Managers (Banks, Financial Institutions)
Red-Flag Geopolitical Exposures: Immediately increase scrutiny on credit and trading exposures linked to global trade lanes, critical minerals, and regions of high geopolitical tension. Update counterparty risk assessments.
Assume a Cyber Attack is Inevitable: Conduct live-fire exercises for a major cyber incident targeting payment systems or market infrastructure. Verify backups and crisis response protocols are battle-ready.
Stress-Test for a "Risk-Off" Spike: Model the impact of a sudden AUD depreciation and sovereign yield spike on your portfolio, particularly for holdings in bonds, currencies, and interest-rate derivatives.
Look for Hidden Leverage: Dig deeper into the creditworthiness of corporate and commercial real estate borrowers. The "hidden slack" in the labor market and high debt burdens could lead to unexpected defaults.
Challenge the Calm: Advocate against complacency. Despite market stability, the report warns of low risk premia and high vulnerability to shocks. Ensure capital and liquidity buffers are adequate for a disorderly reassessment of risk.
From a strategic positioning perspective, investors are currently adopting a cautious stance toward Australian equities, maintaining an underweight allocation relative to global markets. The preference is to focus on high-quality global assets that offer stability and consistent returns amid ongoing domestic and international uncertainties.
At the same time, selective “satellite” exposures are maintained in Australian energy and materials sectors, aimed at capturing the reflationary opportunities anticipated in the second half of 2026, driven by rising commodity prices and ongoing global infrastructure and energy demand.
This approach reflects a balanced strategy, combining defensive allocation to quality global holdings with targeted domestic positions that can benefit from specific cyclical and structural tailwinds, thereby managing risk while remaining positioned for selective upside.
Key Takeaways on Australia's 2026 Financial Market Outlook
Australian Economy in Late-Cycle Phase: The market shows resilience but has entered a mature, late-stage expansion. Growth is moderate, driven by business investment in tech and green energy, not consumer spending.
RBA Policy in "Wait-and-See" Mode: With sticky inflation at 3.4%, the Reserve Bank of Australia is cautious. Interest rates are likely on hold, making monetary policy a key headwind for stocks and mortgages.
"Selective Risk-On" Investment Strategy: Investors are avoiding broad markets and focusing capital on specific high-growth sectors: Technology, Data Infrastructure, and Critical Minerals for the energy transition.
Geopolitical Risks Threaten Trade & Stability: Australia's prosperity hinges on critical mineral exports. Rising U.S.-China tensions and cyber threats pose major risks to trade revenue and financial system security.
Global Liquidity Shift Creates Vulnerability: As worldwide money flow slows, Australia's economy loses a key growth support. This makes the market more sensitive to external shocks, despite strong local employment.
FAQs: Australia Financial Markets Outlook 2026
1.What is Australia's current economic phase?
Australia is in a late-cycle expansion. Growth is steady but slowing, signaling a time for investor caution rather than aggressive risk-taking.
2. Why is the RBA keeping interest rates high?
The RBA is pausing cuts due to stubborn "sticky" inflation and a strong job market. They are prioritizing controlling prices over boosting the economy in the short term.
3. Which Australian sectors are best to invest in now?
Adopt a "selective risk-on" strategy. Focus on Technology, Critical Minerals, and Energy/Resources, while being cautious with banks and property stocks.

.png)
.png)
